Building the Team
The STEPS team
The Science Theater Education Programming System, or STEPS, is a four-year informal science education project (three years of project development plus one year for research) funded by the National Science Foundation (award #0714241).
Fig 1: STEPS Project Logo (http://stepsproject.org/)
The STEPS project has five main deliverables:
- Museum Partnership Network – A community of practice working towards a common goal
- STEPS - A unique and innovative software tool for science theater programming
- A set of performance shows on the sciences of astrobiology
- Professional development products for informal educators – including in-person workshops, on-line tutorials, and inter-museum interactions
- Research – focusing on enhancing informal educators’ sense of professional identity, building the capacities of their institutions, and informing the field about the relationship between professional identity and multi-institution collaborative networks.
To accomplish such a feat, the Principal Investigator (PI) from the Space Science Institute in Boulder, CO, brought together a geographically disperse team including:
8 Museums
Bishop Museum (Honolulu, HI)
Chabot Space and Science Center (Oakland, CA)
Farmington Museum (Farmington, NM)
Kansas Cosmosphere and Space Center (Hutchinson, KS) (NOTE: Due to the economic downturn, this institution had to leave the project early in Year 2)
Montshire Museum of Science (Norwich, VT)
North Museum of Science and Natural History (Lancaster, PA)
Science Museum of Virginia (Richmond, VA)
Space Center Houston (Houston, TX)
2 Professional Organizations
Association of Science-Technology Centers (Washington, DC)
Astronomical Society of the Pacific (San Francisco, CA)
6 Advisory Institutions
Challenger Learning Center of Colorado (Colorado Springs, CO)
Children's Museum of Indianapolis (Indianapolis, IN)
Colorado School of Mines (Golden, CO)
NASA Astrobiology Institute (a virtual, distributed organization)
National Optical Astronomy Observatory (Tucson, AZ)
SETI Institute (Mountain View, CA)
3 Software and Design Firms
Del Padre Visual Productions (East Longmeadow, MA)
ACME Industrial Imagination (Burbank, CA)
Whitney Digital (Burbank, CA)
Evaluators and Researchers
Institute for Learning Innovation (Edgewater, MD)
University of Colorado at Denver (Denver, CO)
The team used the following tools to maintain the collaboration across geographic distances and time zones:
- a project management wiki via Basecamp
- Webex for video and voice conference calls as well as desktop sharing
- face-to-face professional development workshops related to astrobiology, museum theater, and evaluation
- annual full team meetings at ASTC
- individual phone calls and emails
Team leadership theory
To facilitate the achievement of the first deliverable – a museum partnership network – with such a vast group, the PI applied team leadership, as described by Hackman & Walton (1986), Larson & Lafasto (2001, 1989), Northhouse (2004), and others, as an organizational framework, combined with the characteristics and goals of a “community of practice” as described by Wenger (2006). LaFasto and Larson (2001) studied 6,000 work teams in organizations worldwide and developed a framework known as team leadership theory. Their research indicated that team leadership lends itself to greater productivity, more effective resource use, better decisions and problem solving, higher quality products and services, and increased innovation and creativity. The framework espouses eight characteristics for excellence:
- Clear and elevating goal
- Results-driven structure
- Competent team members
- Unified commitment
- Collaborative climate
- Standards of excellence
- Principled leadership
- External support
Team leadership provides a structure for the intentional distribution of leadership among STEPS participants, making each person a stakeholder and potential change agent in the leadership process. This notion is similar to what Collins described in moving employees through progressive stages to becoming leaders in Good to Great (2001), and reflects the notion that leaders should seek to empower those they would lead with leadership potential of their own.
In this framework, leaders must make three crucial decisions: (1) the type of action needed (monitoring or intervention), (2) the level of intervention needed (internal or external), and (3) the function of the intervention, as described by Hackman and Walton (as cited in Northouse, 2004). Unlike other leadership approaches, team leadership goes beyond task and relationship based leader behaviors to include external environmental contexts as well. These include networking, advocating, negotiating support, sharing information, and other functions (Northouse, 2004). So, not only does a team leader need to monitor and assess team work, but he or she must also select the right strategic behaviors to take at the right times, and have the skills to perform the needed actions as well.
Not surprisingly, these leader functions require a high level of communication skills, including those associated with task and relational behaviors as well as external environmental functions. Additionally, the more leadership is shared among the team, the more communication skills are needed from each team member.
This framework was put into action when the team first met in Boulder, CO, at the project kick off meeting held on January 18, 2008. To codify the team leadership structure, team members collaboratively generated and signed three governing documents (i.e. standards of excellence) to enact the principles of team leadership: the Collaborative Framework, the Collaborative Agreement, and the Declaration of Collaborative Excellence. To operationalize the team leadership model throughout the network, the participants created subteams, a network “whip,” and a set of tools and activities to launch the project. They built on this model throughout Year 1 of the project with the following activities:
- Developed an on-line project Web site through Basecamp for messages, milestones, to-do lists, contact info, and write-boards
- Created a public Web site to communicate the project externally (http://stepsproject.org/)
- “Got smart” about the project science content-astrobiology (through invited talks, postings, Adler planetarium workshops, and newsflash updates)
- Conducted the STEPS front-end evaluation
- Formed specific subteams and assigned their leaders (story team, asset production team, audience participation team, professional development team, software team, and research and evaluation team)
- Established a features and functionality list for the STEPS software
- Attended Tessa Bridal's museum theater workshop (Children’s Museum of Indianapolis)
- Conducted baseline research and evaluation on the collaborative
- Attended the STEPS ASTC Year 1 workshop and meeting
Professional identity
Professional identity is a person’s self-perception as a contributing member of a larger group of colleagues and as a part of an extended profession with goals, methods, ideals, behavioral ethics, etc. (Henke, 1993-4, 1997). Enhanced professional identity among educators has been shown to translate into increased job satisfaction, higher quality educational programming, and increased staff retention (Henke, 1997).
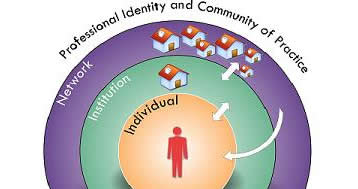
This paper discusses the STEPS project in its second year (Development Phase with formative evaluation) and focuses most specifically on the first deliverable mentioned above, the museum partnership network. Of particular interest to the network is the impact of this project (and its structure) on the professional identities of those involved; namely, that of informal science educators. An affiliated research project was designed to examine this question and to investigate the impacts on institutional identity and capacity. This paper specifically examines the evaluation of professional identity and the process of collaboration within the network (see Figure 2).
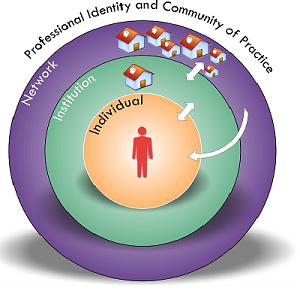
Fig 2: The STEPS collaboration focuses on professional identity and growth by individuals and their institutions
Evaluating the Process
Year 2 (January-December 2009) was a year of many ups and downs on the project as partners left the team due to economic issues or new jobs, and the STEPS software underwent dramatic development with ongoing formative evaluation and research of both the products and the process.
Process evaluation
The world of collaboration research and process evaluation can be a tricky one. The terms are messy and confusing and are thrown around interchangeably. There is network, cooperation, partnership, coalition, team, collaboration/collaborative, and more. Particularly within this group, all of these categories might apply as there are subteams within the overall collaboration (story team, audience participation team, software team, evaluation team, etc.), institutional partnerships within the subteams (each small museum was paired with a large museum), and new opportunities between individuals and institutions of their own interests and accord (new granting opportunities and dissemination efforts). Although throughout this paper the terms “network”, “team”, “partners”, and “collaboration” are used, they are intended to operate from Wenger's definition of a community of practice: “A group of people who share a common concern or passion for something they do, and learn how to do it better as they interact regularly” (2006). STEPS aims to do this through three facets generically articulated by Wenger and then applied to the specifics of the STEPS project as follows:
- The Domain: Shared domain(s) of interest to define the community (museum theater and astrobiology)
- The Community: By forming relationships that facilitate learning (as mentioned above)
- The Practice: Members develop a shared practice over time (resources, experiences, stories, tools, interventions, skills)
Capturing data from such groups is notoriously difficult and often time consuming. "Collaboratives involve multiple actors across multiple systems or sectors, are flexible and evolving, have broad and imprecise goals and seek changes in an array of domains..." (Taylor-Powell & Rossing, 1996). In order for any data analysis to be relevant to the project PI and partners, data needed to be gathered quickly and efficiently with an eye towards maximizing opportunities for reflection and mid-course changes in direction, if need be. In addition, data needed to be dual purpose to capitalize on available resources, such that any process evaluation data could also contribute to the overall research questions and the summative evaluation. Lastly, strategies to mitigate over-sampling of the collaboration members had to be considered. Together, the research and evaluation team devised a strategy in which the evaluation team conducted a quarterly pulse check, while the research team conducted yearly phone interviews, a content analysis of the Basecamp site, and a network path analysis (this last component was not yet available at the time of this paper).
Process evaluation answers questions like: How are we doing? What is happening? Are we on track? Are we achieving our intended outcomes? This data can be used to monitor implementation, redirect efforts, modify strategies, celebrate milestones, and interpret outcomes (Taylor-Powell & Rossing, 1996). Much like rapid prototyping and formative evaluation of products, process evaluation is informative and flexible, in contrast with outcomes-based evaluation, which usually comes towards the end of a project and measures evidence of impact (the type of evaluation that will occur in Years 3 and 4).
The pulse check used for this process evaluation is an on-line questionnaire comprised of rating-based items and open-ended questions that aim to reveal the current state of the collaboration for the STEPS project. The rating items are statements on an agreement scale from 1 (negative) to 7 (positive) considering the collaboration at two perceptual levels: the participant's perception of the collaboration as a whole and the participant's perception of their individual role within that collaboration. Statements covered the topics of communication, leadership, contribution, decision-making, openness, evaluation, goals, time, professional capacity, and satisfaction at these two levels. Table 1 highlights a few examples.
| Topic | Individual Level | Group Level |
|---|---|---|
| Professional capacity | I can contribute outside my primary area of expertise. | The project allows participants to grow. |
| Leadership | I feel empowered to take a leadership role in advancing my area of responsibility on the STEPS project. | STEPS provides opportunities for people to take leadership roles. |
| Goals | From my perspective, the project is achieving the goals I anticipated. | In general, the project seems to be on track and seems to achieve its intermediate goals. |
Table 1: Example statements from pulse check
Each set of 2-3 statements is followed by an open-ended comments box for participants to contextualize their scores. At the end of the survey, an open-ended rotating question, developed in consultation with the PI, addresses a specific issue or timely concern:
- Pulse check 1 (February 2009): How do you see leadership changing in STEPS? (followed by) What do you propose as ways for people to become leaders in this project?
- Pulse check 2 (May 2009): Since the last pulse check, changes have been made in the structure of STEPS...[brief explanation of change in leadership]… What (if any) do you see as advantages or disadvantages for this more sequential model of building on each other's work?
- Pulse check 3 (August 2009): STEPS is at its half-way mark! Stories are being completed, the software team is moving forward...[list of recent accomplishments]. Looking ahead, what clarity do you need, if any, with the remaining parts of the project and your role within it (from now until ASTC 2010)? Please describe in as much detail as possible.
- Pulse check 4 (November 2009): Now that you have seen STEPS in action or maybe even actually used it, in what ways does that knowledge and experience impact your perspectives on the final year of work ahead of us? For instance, does it excite? Intimidate? Motivate?
The last two or three questions in each pulse check are also open-ended. They are more general, allowing participants to raise anything that is on their minds regarding the project:
- Please complete the following statement: At this point, I believe that an issue that needs to be discussed or resolved in the short term is…
- Since the last survey, what, if anything, is different now in your relationships within, and /or attitudes towards the STEPS project?
The results of each pulse check bring to the fore potential issues and aspects that could, if addressed, improve the process of collaboration. Pulse checks are conducted every three months. The responses are exported into SPSS statistical software after each period of data collection, then analyzed and summarized in a memo report and shared back with the PI. The evaluator reports the results to the team in the all-hands video conference that occurs in the month following the pulse check – referred to as “taking a look in the mirror”. The project leaders from the Space Science Institute then discuss any changes that may occur to the collaboration process and such changes are implemented immediately. At the time of this paper, 4 out of 6 total pulse checks have been conducted [1]:
- Pulse check 1=17 responses
- Data collected in February
- Analyzed in March
- Discussed with team March 11, 2009
- Pulse check 2=13 responses
- Data collected in May
- Analyzed in June
- Discussed with team June 10, 2009
- Pulse check 3=11 responses
- Data collected in August
- Analyzed in September
- Discussed with team September 9, 2009
- Pulse check 4=14 responses
- Data collected in November
- Analyzed in December
- Discussed with team December 9, 2009
Only primary team members, those actively involved and engaged in the partnership at the time of the pulse check, were expected to respond to the survey. The scores of all individuals who contributed to each pulse check are represented in the charts and figures that follow in this paper. Although this is a smaller sample than described above (n=8), a comparison of trends between averages for the whole group in each pulse check and averages for members who provided all four data points over time showed no significant differences. In this mixed methods approach, the quantitative data was used primarily as a visual aid to highlight trends, whereas the qualitative data was used to make mid-course changes and to explain any dramatic shifts in individual and team attitudes towards the process.
Content analysis of Basecamp
As a second source of data, the research team reviews the activity on the Basecamp site at the end of each project year. This is an unobtrusive way of collecting data that can be used to triangulate with other data sources. All postings to the Basecamp site from January 1, 2009, through December 24, 2009, were reviewed. As the research team was tasked with attempting to gauge participant involvement in the Basecamp site (and, by inference, the project as a whole), each posted message was coded only once, rather than multi-coding within a submission. This method places a priority on individual communications through the Basecamp site (whether through messages or through log-ins to the system for activity on the write boards).
Applying a standard content analysis technique (Stemler, 2001), the researcher identified a set of emergent coding categories to capture the essence of communication occurring on Basecamp. The categories were: Research Tasks, Agenda, Scheduling, Edification, Network Paths, Technical Issues (including financials), and Milestones (or task completion). With the bulk of the analysis for the research study occurring in Year 4, this paper only highlights the total contributions of each individual in comparison to the group average as an indicator of participation, and as a corollary to some of the findings from the process evaluation.
Of course this strategy does not account for the additional ways in which individuals communicate outside of the project management space – phone calls, private e-mails, instant messaging, etc. However, as anyone who has tried to maintain a dispersed community will know, the tools for collaboration are only as strong as the participants’ use of them; thus this method proves to be a helpful proxy and relevant second-tier data source for gauging connectedness to the community.
Sustaining On-line Collaboration
In synthesizing these assessment results into meaningful information, comparisons were conducted and trends were identified. A comparison of the four pulse checks highlights the ups and downs of product and professional development. It is clear two years into the project that STEPS partners feel they are growing in their professional capacity. Charts 1-4 highlight the success of team leadership theory as a framework for empowering individuals, demonstrating dramatic increases in scores by the time of the final pulse check, which took place just after the Year 2 team meeting at ASTC (Ft. Worth, TX).
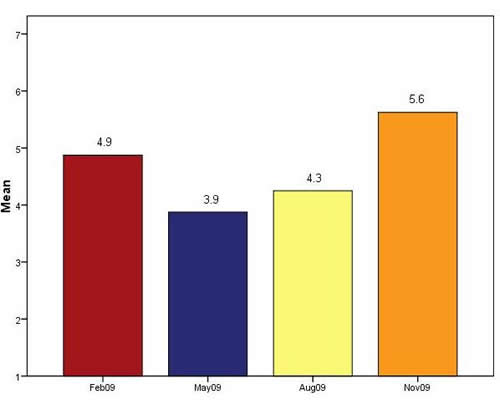
Chart 1: I have grown in my professional capacity through my collaboration on this project
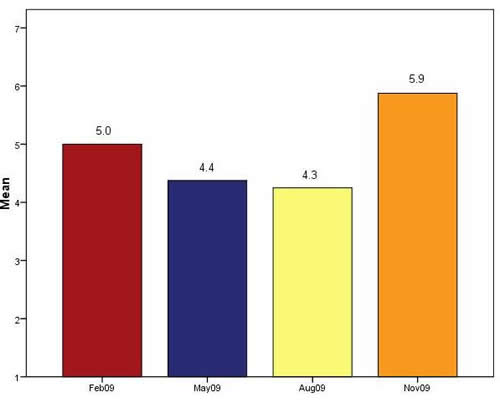
Chart 2: I can use what I learn in STEPS in other areas of my professional life
The increase in scores in Charts 1 and 2 is very encouraging as professional development and identity is a core component of the STEPS project deliverables and the primary focus of the leadership framework for the collaboration. Despite the many challenges of working in an on-line collaborative network, participants are capitalizing on its benefits for their personal and professional growth. Participants cite learning gains for working in such a collaboration, leadership skills, opportunities for working in areas outside their expertise (a necessary feature for dramatic growth), and general professional development opportunities, highlighted by the following comments:
- “I have definitely grown in professional capacity as I'm doing things that I would never otherwise have the opportunity to do without the grant.”
- “Working on a collaboration is a unique experience especially when that collaboration is between people who generally have a lot more sway or executive control outside of [a project like this]. I have definitely learned to be more diplomatic in my opinions and comments and I have learned valuable lessons on the pros and cons of large group efforts.”
- “To the extent that I am involved, I am learning new things.”
- “STEPS has been great to learn how to function better in a collaboration and how to be a good leader.”
- “I think you can grow from any project that you work on -especially a large group collaborative.”
- “…Now that I have a stronger involvement with the project, I have been able to pave my own direction in professional development interests…”
- “I really enjoyed the [two] workshops that I have attended and felt that I contributed and learned.”
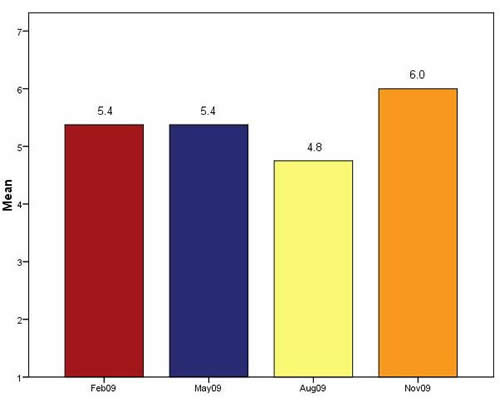
Chart 3: People can contribute outside their primary area of expertise
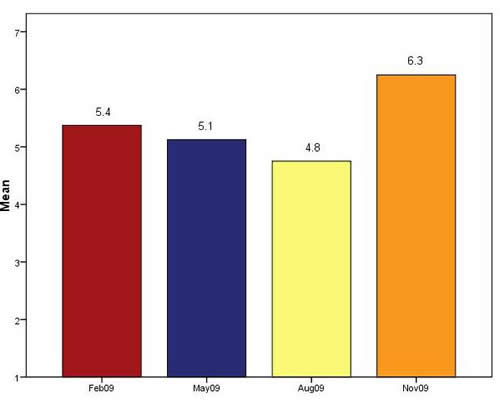
Chart 4: The project allows participants to grow
Taking a step back, respondents gave each of the statements in Charts 3 and 4 higher average scores than even the baseline study from February. Comments make it clear that the structure of the collaboration allows for professional and personal growth and that the onus of initiative is on the participant. One comment summarizes others quite well: “I think it is fair to say that at this point if people are not growing and adopting an active position in the project, it is not for lack of opportunity.” The importance of this element is hard to overstate, since individual initiative is essential to leadership in general and therefore also to team leadership theory. One of the challenges of using the team leadership framework has been to create an environment allowing for the emergence of latent leaders and opportunities for growth across the network – a challenge successfully met in Year 2 through the tools and interactions of the network.
However, with such a distributed leadership model (as outlined earlier), the team continues to struggle with issues around decision making and goal attainment: a calculated risk made by the PI in an effort to maintain opportunities for enhancing professional identity and capacity. Charts 5-9 make clear some of these issues.

Chart 5: From my perspective, the project is achieving the goals I anticipated
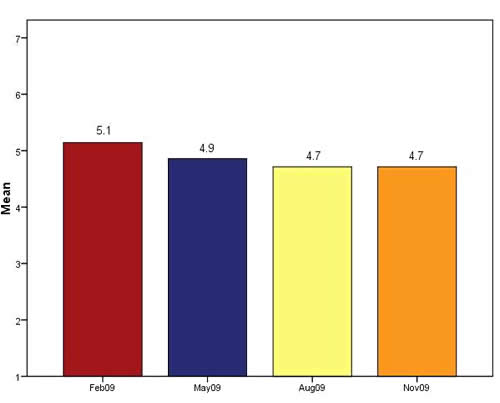
Chart 6: In general, the project seems to be on track and seems to achieve its intermediate goals
Charts 5 and 6 show participant scores related to product-oriented goals remained moderate to low by the end of Year 2. As each participant has his or her own set of expectations in this regard, comments covered anything from the software, to the stories, to enabling individuals to conduct museum theatre.
Comments related to goals for software:
- “I feel the software is definitely achieving the goals anticipated if not surpassing them.”
Comments related to goals for the stories:
- “The stories...I feel are technically achieving the goals but perhaps falling short of what I would like to see.”
- “Overall, the project is achieving its goals but at a much slower pace than [I] would like. A lot of that is the delay in getting the stories finished…. The project does take an astronomical amount of time if the project is to be done right. However, a lot of sacrifices are made as we all take on multiple jobs at our institutions.”
Comments related to goals for museum theatre:
- “I am taking a wait-and-see approach. I think it's a stretch to create theater expertise among staff with little experience. You can give them more experience, but you're not going to turn them into experts.”
- “I admit to having a lack of clarity of some of the project objectives. I keep thinking of this as a theater project, and am somewhat skeptical that there is a viable platform for this across the science museum field.”
Comments related to goals for the project in general:
- “Goals are pretty much what I expected. I thought the project would be further along by now, but I also still think it is on track to reaching completion.”
- “We are on track, but it does take a lot of time. We would be spending time no matter what, and have to…I think decision making in a large group is one of our biggest challenges…”
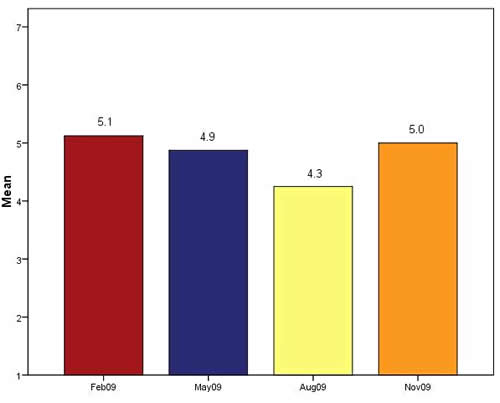
Chart 7: Decision-making is fair and equitably distributed among the partners

Chart 8: Decisions are made effectively and efficiently
The collaboration is a large and diverse entity governing a project with many moving parts across various time zones and within disparate institution types; and these types of efforts are known to take time. Comments associated with Charts 7 and 8 regarding decision making on the project include:
- its occasional lack of clarity (e.g. “Sometimes the decision making process is less obvious than I'd like”);
- issues with transition from small-group decision-making to the whole team (e.g. “We have taken to trying to make decisions in small groups, which is helpful…when we do get together as a larger group, some time is spent getting the folks not in on the previous discussion up to speed. I know it is necessary, but it can often be sort of 2 steps forward, one back...”);
- inefficient teleconferences (e.g. “Telecons haven't seemed to be effective and efficient. We get off topic a lot… stronger facilitation methods could be employed to keep some meetings to the point.”);
- and, being able to move forward small ideas or low-level feedback through a large group (e.g. “It is impossible to run something small by the group without it turning into an hour long giant discussion even if the conclusion/solution/answer is readily identified.”)
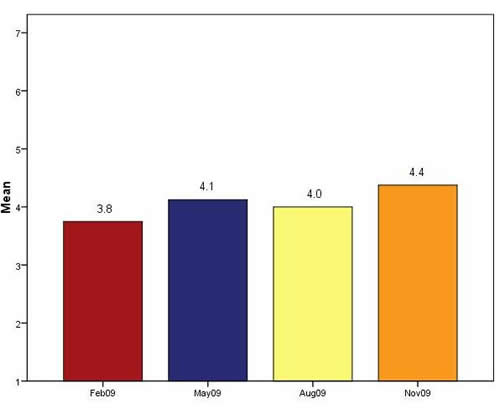
Chart 9: Coordination between the various subteams works well
Finally, the use of subteams is a key strategy called for by team leadership theory: one in which leadership and responsibility is distributed. This score continues to slowly increase, as shown in Chart 9, although many of the same comments remain from previous pulse checks:
- “Subteam coordination could be better. Some subteams are dependent on the progress of the other subteams, but the subteam leaders don't always seem to take this into consideration.”
- “Teams initially needed time to determine how they needed to work together but have altered meetings to fit with the immediate needs of the project.”
- “Subteams have some overlap...this helps a bunch so at least one person is up to speed on the other goings-on.”
- “There really hasn't been any coordination between sub teams…But best coordination to date is now as Audience and Story are talking about how to incorporate activities [while] writing the rough draft. Plus it's obvious that other teams, myself included, have not been looking at information being posted on Basecamp…to…update the other teams.”
- “Collaboration between the subteams is hard, I'm not sure if it could work better.”
Finally, the Year 2 Basecamp analysis echoes these findings from the perspective of participation. For Year 2, the median number of contributions to Basecamp was 60.00, with a high standard deviation, indicating an exceptionally wide range of contribution levels. Comparing each individual score to the mean provides a sense of the participation levels in the project through Basecamp.

Fig 3: Graphic representation of Basecamp participation (aliases have been used to preserve anonymity of the participants) ( a denotes that the participant left the project during the year)
With regards to developing any community of practice (CoP), it should not be unusual to expect varied participation levels over time. However, even in this initial analysis, some participants have substantially lower levels of involvement on the shared project space than others. Some of these reasons (such as giving birth, being added to the project after its onset, increased time commitments from other projects, etc.) are evident from follow-up phone interviews. Research in Year 4 will focus on what determines or influences the varying levels of involvement and whether these are institutional/macro-level factors or individual/micro-level factors.
Using Research and Evaluation to Make Data-driven Decisions
While the results of the pulse checks seem quite interesting, the quotes from participants illuminating, and graphical representations of participation confirmatory, that leaves the big, remaining question: “So what?” As described earlier, the process of conducting a pulse check does not stop at data collection and analysis. Those results are then reviewed in a group call between the evaluation team and the project PI. The PI and project manager then consider implications and action items moving forward before sharing back with the rest of the project team. In most cases this involved consideration of any major issues and also grabbing at the “low-hanging fruit” (e.g. closing the Story team teleconferences to increase team productivity; see pulse check 1 changes below). After each pulse check a handful of changes were implemented into the collaboration process in an effort towards responsiveness.
After pulse check 1, the following changes and action steps were made:
- The Story team took the lead on the timeline rather than having all subteams trying to work in parallel.
- The Story team started holding closed teleconferences to maximize the creative process in order to push deliverables out to other subteams more quickly (the original model allowed anyone at any time to join a subteam teleconference and lurk or participate).
- The project leaders began hosting subteam leader teleconferences to review critical paths in the timeline between subteams.
After pulse check 2, these changes were made:
- The decision-making form (filled out by the subteam leader during each call) was changed to be more “decision-driven”. The forms were used to identify decisions that needed to be made before a subteam call and the results of those decisions after a call, in an effort to maximize and make more transparent the decision-making process.
- The PI began a series of one-on-one calls with the project partners and their higher-ups (when possible) to increase awareness of STEPS at the institutional level and to support the project partners.
After pulse check 3, these changes were made:
- A monthly executive summary was planned to be shared with the directors of the partner institutions (again, to increase awareness of STEPS at the institutional level). Due to conferences and holidays, however, this did not get underway before pulse check 4 was deployed.
- The overall project leaders scheduled update calls with STEPS participants and their supervisors or institutional directors in order to facilitate intra-organization communication and support.
After pulse check 4, these changes were made:
- Participants were encouraged to consider alternative methods for completing milestones between conference calls.
- The Year 2 subteams were dissolved and reformed into new subteams around production and evaluation.
- The first executive summary was sent out to directors of the partner institutions highlighting recent accomplishments and upcoming milestones.
In addition, each pulse check gave the team members an opportunity to reflect on their own contributions to the whole and provided an avenue for voicing opinions anonymously. For personal issues, it served as a vehicle for the PI to engage with individuals off-line to resolve myriad issues from lack of institutional support, low morale about the project, or competing projects that may have been affecting STEPS participation.
If We Had to Do It All Over Again...
Although this is by no means the fastest way to get a project done, it has clearly been effective at the professional development aim of the project. If the team had the project to do all over again there are some things that would stay and some things that would definitely change. Here are the authors’ reflections two years into the project.
- From a project management perspective, the tools employed had their own sets of pluses and minuses. It is easy for people to get into a habit and stick with it.
- The over-reliance on teleconferences may have slowed production and/or decreased motivation (it's a passive form of participation in many instances), although it did support progression towards milestones. Basecamp is a project management wiki that is used by many in the field, so from a familiarity perspective, it worked well, but sometimes the way in which it was used proved to do more harm than good. For example, pulse checks revealed that individuals felt inundated by e-mails that may or may not have been relevant to them, making them less likely to read future emails. Also, when individuals have over-relied on Basecamp for communications, otherwise private issues or aggravations have become public, exacerbating the situation.
- For those feeling bound by the constraints of a wiki like Basecamp, consider mashing up different tools to support the best levels of communication and flexibility within a large group. Some sort of chat feature in combination with a wiki for file sharing, and also a communications protocol to reduce inadvertent spamming would probably prove successful. Coming slowly are tools that can do all three of those things and allow for a bit more flexibility. Google Wave, for example, is an emerging application that would allow for the many features that Basecamp and other wikis have to offer (document sharing, conversation capture, project management tools via extensions and gadgets), but have additional visual cues for who is participating in a conversation.
- Webex worked out well as an on-the-phone accountability tool and a desktop sharing tool. At its current level, videoconferencing does not replace the need for face-to-face interaction, but it does allow one to see who is actively participating in the conversation versus passively listening or doing something else.
- In addition to wikis and videoconferencing, the data suggests that face-to-face interactions have the ability to gel team members in a way that no on-line collaboration tool probably ever will. A healthy balance between the two strategies is likely the sweet spot for building a community of practice.
- Further, tying those face-to-face interactions with professional development opportunities (for STEPS there were astrobiology, museum theater, and evaluation workshops), allows for progression towards project milestones as well as opportunities to engage with project partners at various levels and in several different geographic locations.
- Counterintuitive as it may sound, the PI has considered an approach that isolates the subteams more until critical path milestones are met. This may alleviate issues of slow progress due to large group lag and also the overburden of messages and information largely unrelated to any one participant. This approach may allow for more focused and efficient small group efforts, yet would require further investigation to actually be recommended.
From an evaluation perspective, the pulse checks actually worked quite well. They were light-weight and actionable as intended. Conducting them every 3-4 months seems to be an adequate span of time - issues were caught early on without burdening the partners with too many surveys. Allowing participants the space to contextualize their scores remedied any issues of validity testing in the constructs of the statements. In formative evaluation there is simply not enough time to run rigorous pilot tests of instruments before using them on a rather small and isolated population. This is important because it suggests that just about anyone (with limited survey construction experience) could track the "pulse" of their collaboration and obtain reliable and actionable data.
Some recommendations for future process evaluation or pulse check efforts would be:
- To create a pulse check, first make a list of the key elements of the project that are most important. For example, leadership and professional capacity were core goals of the STEPS project and knowing when issues were arising in these two categories throughout Year 2 were critical for ensuring success by the end of Year 3.
- Try to keep the list of statements as short as possible while approaching the topics from multiple levels. Indeed, for the fifth pulse check, a few statements will be removed that seem to be redundant or "double-barreled" (a term used to identify a survey question or statement that has two constructs within it. For example, "I can contribute equally and fairly" has the constructs of both "equal" and "fair" in it, which makes it more difficult for individuals to choose a score if they do not perceive those two words as synonyms.)
- Include an open-ended comments box after every 2-3 statements to allow participants to contextualize their scores. A score of 4 may have more to do with the fact that the individual has not been able to engage with the project as much, rather than a negative perception of leadership opportunities, for example. The quality of these open-ended responses alone also indicates the degree to which participants thought through the survey and engaged in the process of self reflection.
A Look Ahead...
STEPS is scheduled to deliver four of its primary deliverables in October 2010 at the ASTC Conference in Hawaii. Between now and then, all museum partners will be expected to perform STEPS shows at their museums and/or in outreach programs in concert with the project evaluation plan. The team will also be creating new subteams for the professional development of museum partners. These include (among others) a production team that will be responsible for bringing a show from paper to performance; and a marketing/ dissemination team that will be responsible for generating awareness about STEPS to the national community of informal educators. There will also be some on-line professional development workshops related to successful proposal writing (a stated interest of the participants).
The research into the collaboration and its lasting impacts on professional identity will continue into Year 4, resulting in a study that combines much of the data described here with future results. The National Science Foundation, as the funding agency, is extremely interested in the outcomes of this study not only for its implications for team leadership as applied to multi-institution on-line collaborations, but also for its ground-breaking examination of the professional identities of informal science educators and how to enhance them. To date, this is an area needing more research.
References
Collins, J. (2001). Good to great. New York: Harper Collins Publishers.
LaFasto, F.M.J., & C.E. Larson (2001). When teams work best: 6,000 team members and leaders tell what it takes to succeed. Thousand Oaks, CA: Sage.
Hackman, J.R., & R.E. Walton (1986). “Leading groups in organizations”. In Goodman, P.S. (Ed.), Designing effective work groups. San Francisco: Jossey-Bass, pp.72-119.
Henke, S.P., C.X. Chen, S. Geis, M.N. Alt and S.P. Broughman (1993-4, 1997). America’s Teachers: Profile of a Profession. U.S. Department of Education, National Center for Education Statistics, NCES 97-460, Washington, D.C.
Larson, C. E. & F.M.J. LaFasto (1989). Teamwork: What must go right/what can go wrong. Newbury Park, CA: Sage.
Stemler, S. (2001). An overview of content analysis. Practical Assessment, Research & Evaluation 7(17). Accessed January 29, 2010, at http://PAREonline.net/getvn.asp?v=7&n=17.
Taylor-Powell, E., & B. Rossing (November 1996). Evaluating Collaboratives: Challenges and Methods. Paper presented at the American Evaluation Association annual meeting, Atlanta, GA. Accessed January 20, 2010, from http://danr.ucop.edu/eee-aea/rossing.html.
Wenger, E. (2006). Communities of practice. Accessed January 28, 2010, from http://www.ewenger.com/theory/index.htm.
Wenger, E. (June/July 1998). Communities of practice: Learning as a social system. Systems Thinker 9(5). Accessed January 28, 2010, from http://www.co-i-l.com/coil/knowledge-garden/cop/lss.shtml.