
Papers

Reports and analyses from around the world are presented at MW2005.
| Workshops |
| Sessions |
| Speakers |
| Interactions |
| Demonstrations |
| Exhibits |
| Best of the Web |
| produced by
|
| Search A&MI
|
| Join our Mailing List Privacy Policy |
Beyond Hits: Gauging Visitor Behavior at an On-line Manufacturing Exhibit
Leilah Lyons and Zbigniew Pasek, University of Michigan, USA
Abstract
To extend its educational reach to the non-university population, the NSF Engineering Research Center for Reconfigurable Manufacturing Systems (ERC/RMS) at the University of Michigan has invested in designing and developing a museum exhibit highlighting the principles of modern manufacturing (Kaynar, Pasek, & Lyons, 2004). Although primarily a physical exhibit in the Ann Arbor Hands-On Museum, the ERC/RMS has produced an on-line version of the exhibit's educational game. We will discuss how we engineered the user data collection for the on-line version of this game, what the rationale was behind technology decisions, and what corresponding issues (technical and ethical) had to be considered in targeting certain types of data for collection. We will use the collected data in three ways: 1) to map the (self-reported) demographics of the on-line visitor population, 2) to determine potential interruption spots in the game-playing flow (to improve the game design), and 3) to assess how effectively the target concepts are communicated by the exhibit. Results collected from the exhibit's educational game are used to demonstrate the value of such analyses.
Keywords: educational software, manufacturing education, highly interactive media.
Introduction
Evaluation is a classic problem with on-line exhibits: unlike with physical exhibits, it is impossible for a researcher to sit with notebook and timer and watch a visitor browse an on-line exhibit. Although hit data can help a researcher make aggregate inferences about the popularity of an on-line exhibit, other assessments, such as gauging the learning of individual visitors, are more difficult. Current multimedia technology allows for much more interactivity than the 'click-throughs' of traditional hypertext presentations. Likewise, visitor experience assessment should be more detailed, but there are no standard ways of collecting information about a user's experience with highly interactive presentations (such as Macromedia Flash or Shockwave files) – such data collection processes and supporting technical infrastructure are yet to be engineered.
Project Background
Dependence of modern societies on technology steadily grows and even accelerates, yet a society-wide understanding of technology (which is needed for informed and critical decision-making) is usually lacking. The importance of inducing technological literacy and interests in youth cannot be overstated, as it affects also future supply of engineers and scientists.
Contemporary American youths are avid consumers of manufactured products. They are very familiar with a wide variety of available consumer products due to the efforts of marketing campaigns, advertising media and their own use of the Internet. However, as they buy and use today's products, they likely hold no concept of how these products came to exist or how they were made. Overall, the general public's knowledge of manufacturing is relatively limited and outdated. This lack of knowledge creates a demotivational barrier preventing many potential students from entering the field. Such a knowledge gap creates an opportunity to educate the general public about what constitutes modern manufacturing.
An exemplary effort to bridge the technological literacy gap is currently under way at the NSF Engineering Research Center for Reconfigurable Manufacturing Systems (ERC/RMS) at the University of Michigan. To extend its educational reach to the non-university population, the ERC/RMS has invested in designing and developing a museum exhibit that highlights the principles of modern manufacturing with a series of educational computer games. The main purpose of the exhibit is to educate visitors about the processes in three fields crucial to industrial production – product design, manufacturing, and marketing – and show how these fields interrelate in order to develop manufactured goods. A deeper goal of the games is to introduce children, especially girls, to the types of professions found in these areas in such a way that they might later consider careers in one of the three fields (Baker, 1993).
To illustrate processes found in product design, manufacturing, and marketing, the user is interactively led through the development cycle of an example product, specifically, a customizable pen. The interactive tasks that the user is asked to complete are simplified versions of tasks found in the real-world professions represented by the games, or tasks that encapsulate some of the ongoing concerns of professionals in that field. The three games created for this exhibit, Design Station, Some Assembly Required, and Business as Usual, have environments set in the offices of a design firm, the floor of a manufacturing plant, and a marketing office, respectively. Each of the games follows a common structure: the player is greeted by an avatar representing an employee of the environment, who introduces the setting and explains in general the type of work found in that environment. The host avatar then explains to the user that the host will need the player's help in completing a task in the environment, and explains how the task is to be executed. Upon completion of the in-game tasks, the user's performance is rated and the user is given detailed feedback about the basis for the score. An assessment of the user's comprehension of concepts and terminology presented in the exhibit is incorporated into the game under the guise of a bonus quiz.
The first of these games, Design Station, focuses on product design. The first task in this game is to visit a mall and conduct market research by interviewing mallgoers about their preferences in pens. The second task is to construct a pen design from available components that best matches the consumers' needs. Design Station has been installed on the floor of the Ann Arbor Hands-On Museum for several months, and has been locally collecting and recording usage data. Although it was developed with Macromedia Director with the express purpose of being easily deployable on the Web, some additional engineering was required before making it available through the Ann Arbor Hands-On Museum Web site, to allow for sophisticated usage tracking and reporting over the Internet.
Engineering Data Collection for Highly-Interactive Web Media
Standard Web Usage Data Collection Methods
The use of server-collected usage statistics in evaluating Web sites is hardly a new idea, but traditional methods are limited in both the variety of data available for collection and the accuracy of conclusions that can be drawn from that data. With traditional Web servers and HTML-based Web sites, the most direct means of data collection is through server logs which record details of the server's responses to requests for Web data (Bertot, McClure, Moen, & Rubin, 1997). Unfortunately, the information that can be gleaned from server logs is extremely general: the IP address of the requestor, the time of the request, and the Web site content requested make up the bulk of the relevant information (Burton & Walther, 2001). Gleaning a full understanding of a user's experience from so few features is difficult on its own, but there are real problems inherent in analyzing server log data.
Although one can attempt to make inferences about a user's experience by analyzing all requests made from a given IP address, this method has complications: one can never know whether the IP address is representative of the same single user. Many institutions assign IP addresses dynamically and automatically through the Dynamic Host Configuration Protocol (DHCP), which means that a given IP address may or may not be assigned to the same user's machine from one moment to another. Further complicating matters, many large institutions, like corporations, route all HyperText Transfer Protocol (HTTP) traffic through a single proxy server, which means that all Web page requests from users at that institution will bear the same IP address. Moreover, caching of Web pages can occur on these intermediate servers, preventing requests from being sent to the original server and recorded in server logs. Therefore, drawing any conclusions about user behaviour from server log data alone is near-impossible (Goldberg, 1995).
Some researchers and commercial entities have attempted to correct for this problem with the use of client-side solutions, which involve storing data or even using logs on the client machine (Catledge & Pitkow, 1995; Martin, Wu, & Alsaid, 2003). The most common practice is to make use of cookies, small data files stored locally by the Web browser, to retain unique identifiers for each end-user, thus eliminating the identity uncertainty associated with server logs. Of course, there is no reason that the contents of the cookie need to be limited to just a unique identifier: many other types of information can (and are, to the consternation of those concerned with privacy issues) stored within cookies.
Usage Data Collection And Highly-Interactive Media Development
Although cookies are frequently used with traditional HTML Web pages, allowing for richer (and more accurate) analyses of server log files, interactive Web-based media like Macromedia Flash and Director movies do not record cookies by default, and do not necessarily make any requests to the server that can be recorded. Commonly, a user who begins interacting with such a movie enters a 'black hole' for a spell of time, wherein no useful statistics are recorded by the server log file. What happens is this: a user's computer requests a page containing the interactive media element; this request is recorded; and the media element's data is served to the requestor's machine. The user's browser begins playing the media element, but for the period of time where the user is interacting with the media element, no further requests are (by default) transmitted back to the Web server. Without intercession on the part of the media element's developer, there is no way to empirically determine how long and in what ways the user interacted with the media element.
Web sites need not host 'black hole' media elements, however – there are ways to record a user's actions (and other information) while interacting with a media element. For the purposes of this paper, we will discuss how to implement use collection strategies within a Macromedia Director movie, but the principles apply equally well to Macromedia Flash, JavaScript, and other interactive media.
Cookies And Highly-Interactive Media
Developers of Director and Flash movies are able to use cookies, but must explicitly cause them to be created and stored on the client's machine. In the case of Director movies, an additional module for the Shockwave player (known as an Xtra) may need to be downloaded and installed on the client machine before files can be written to it, and with some of these Xtras, care must be taken that the path to the cookie does not exceed a certain number of characters, or does not contain white space. Developers also need to worry about making their cookie-writing routines platform-independent, and must include work-arounds for scenarios where the Shockwave player does not have permission to save cookies (which can happen if the client machine has been locked-down by an administrator). For all of these reasons, it can be expedient to store variables (like a unique ID) in memory while the media file is being played, and not to bother with storing a cookie. A goal of museum Web pages, much like the goal of museums themselves, is to provide users with enjoyable browsing experiences, and the extra hassle of local file management may interfere with that experience.
The consequence of not using cookies is that every user revisiting a page containing interactive media is given a new unique ID. But this is perfectly acceptable. One cannot guarantee that the same user has returned to that page – many users may share a client machine (and even a login to that client machine), especially if it is a home computer. For the span of time that a user has the interactive media element open on a Web page, the unique ID is maintained in memory, and so all of the reported actions can be properly attributed to that unique ID. If the media element is intended to be revisited by a user, however, and that user's experience (such as a saved game) needs to be retained from one use to the next, the utility provided by cookies certainly outweighs potential complications with managing local files on client machines.
Caching and highly-interactive media
As mentioned before, caching of Web pages can prevent a server from ever recording accesses from client machines. Interactive media elements, and requests they might make of the server, can also be cached. To prevent caching, certain strategies can be used, such as appending the user's unique ID and the current time to any HTTP request to the server as dummy variables. This will prevent intermediate servers from recognizing the requests and using cached material, forcing a response from the hosting server. If caching workarounds are used to allow for data collection, however, careful thought should be given to how long the Web site will be collecting data. Caching exists to decrease the amount of time it takes to obtain Web data, decrease the load placed on the original hosting servers, and decrease the overall amount of traffic on the Web. Conscientious developers will either build a data collection expiration date into an interactive media element, after which the caching workarounds will automatically be disabled, or will incorporate such an expiration date into a server-side file that will be polled by the interactive media element when it begins to run on a client machine.
Reporting Data From Highly-Interactive Media
When a highly interactive media element reports data back to the server, the designer can select between two styles of reporting: messages with callbacks and messages without callbacks. A callback is a function (resident within the highly interactive media element) that is triggered when the server responds to a request. They are very useful when one wishes the media element to pause until a response is obtained – for example, when the element is waiting for the server to assign a unique ID that will be used in future requests from the element. On the other hand, there are other scenarios where the element does not need a receipt for its request. For example, if the media element is a game that requires the user to click rapidly on a number of objects, user click data should be unicast without any expectation of a response from the server, so that the playback of the media element is not hampered by the overhead of processing callbacks. By not using callbacks, one runs the risk of losing some packets, but this is acceptable in many cases. If data is reported to the server in small chunks as the interaction with the media element progresses (as opposed to one or more larger log files), the risk of slowdowns and lost data is decreased.
Server-Side Implementation
Of course, with all this data being broadcast from the interactive media elements running on client machines, the server must be prepared to receive it. We found it convenient to use a MySQL database as the data repository, and the PHP scripting language to control unique ID assignments and data submissions to the database. Most data is sent to the server in clear text URL request strings to particular PHP files. Although this would not be ideal if we were transmitting sensitive information, such as the names of users or bank account numbers, for our purposes it works well enough. The tables in the MySQL database hold unique IDs, in-game parameters unique to each user (for example, the clues revealed to the user while interviewing mall denizens, or which bonus questions were randomly selected), user clicks, and other in-game user actions (such as the choices made while designing the pen, or answering the bonus questions).
Demographic Data Collection
Ethical Issues Of Demographic Data Collection
Anecdotally speaking, female subjects are less likely to become engaged by technologically-heavy exhibits in science museums, so in designing our game, much effort was put into ensuring that female museum visitors would be just as likely to use and enjoy it as male visitors (Carlisle, 1985). We also wanted to determine how the game was being used by different age groups, to see if it had broad appeal, and to see if the target age range was able to succeed with the game. For this reason, it was important to us that we be able to collect demographic data such as the gender and age of the users. In the physical installation, we obtained permission from the museum to collect this information, to embed the demographic survey in the beginning of our game, and to store the data locally on the machine running the game in the museum exhibit. With the Web version, however, we needed to think a bit more carefully about the ethical ramifications of reporting information over the Internet.
Many Web sites make use of invisible (or single-pixel) Web page elements known as Web bugs for information reporting purposes (Martin, Wu, & Alsaid, 2003). Snippets of code are attached to these Web bugs that capture and send information back to the hosting server, and sometimes the information targeted can be sensitive: like names, addresses, and other personal information. Another form of information reporting software is what is known as spyware, which is often distributed via computer viruses and used to capture and report on user keystrokes. Sometimes this is used for clearly nefarious purposes, like capturing secret passwords as the users type them, and sometimes it is used for merely questionable purposes, such as collecting information for marketing research firms. The last thing we would want is for our software, which reports personal information in addition to keystroke-level data, to be misperceived as being in the same shadowy ethical category as Web bugs or spyware.
Although there are no easy answers to this dilemma, researchers who have studied and considered the ethical ramifications of collecting information through the Internet seem to have settled on a few guidelines for how to collect data ethically (Sandvig & Murase, 2000; Thomas, 1996). According to these guidelines, it is best if no personally identifiable information, like names and addresses, is collected, so we decided against having each user enter a name that we could potentially use to identify the user from the same IP address as a returning visitor. It is also recommended that the Web site contain a clear disclosure of the fact that data will be collected, in addition to the reason for the data collection, and an explanation of how that data will subsequently be used (for example, if the data will be made available to other researchers or institutions). For this reason, we made sure that as soon as a game is initiated, the user is presented with a disclosure screen (see Fig. 1). We attempted to make the language as easy to understand as possible, because children are our main target audience. Because children may not legally be allowed to give informed consent, we make sure to mention that they need permission from their parents.
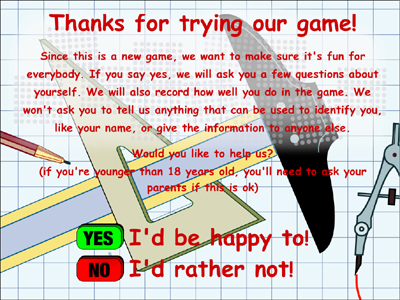
Fig 1: Screenshot from the informed consent portion of the game
With Web surveys, it is always recommended that a user who does not wish to participate be given the option to opt out of the data collection. Because this is a Web site that is intended to provide an educational public service, we decided to allow the user to continue with the game whatever the decision about participating in the data collection (see Fig. 1). There's always a risk of self-selection, meaning that the users who chose to participate may differ in some important ways (whether it be demographically, or behaviourally) from the users who choose to opt out, but we really can't ethically avoid this problem. We just have to be careful, when analyzing the data and presenting results, that this potential confounding issue is mentioned. There is also the possibility of a Hawthorne effect, wherein the subjects behave differently under the knowledge that their performance is being evaluated. There is no ethical way to avoid this problem, unfortunately.
User Interface Issues And Demographic Data Collection
Researchers working with on-line survey forms have found that if the survey is too long, or is laid out visually in a confusing manner, users may decide not to follow through with it (Andrews, Nonnecke, & Preece, 2003). In designing the user interface for the informed consent and demographic collection screens, then, we had to be careful that we balanced our ethical responsibilities with these practicalities, so we didn't lose too many subjects due to attrition. We limited the amount of demographic data we would collect to just two dimensions, age and gender, so that a user would not have to click through very many data collection screens prior to playing the game. We further simplified the data collection process by providing buttons for data entry, buttons that would automatically advance the user to the next screen when clicked (see Fig. 2 and Fig. 3). Like the 'one-click shopping' seen in commercial Web sites, we wanted to decrease the overhead of user actions required to complete the data collection task. To do so, we had to codify the ages into buttons (as opposed to allowing the user to type in an age), which meant that some buttons represented groups of ages (for example, the age six or younger button and the age 15 or older button). This was deemed acceptable, since the age range we were targeting with the game was 7 to 14 years.

Fig 2: Screenshot from the gender demographic data collection portion of the game
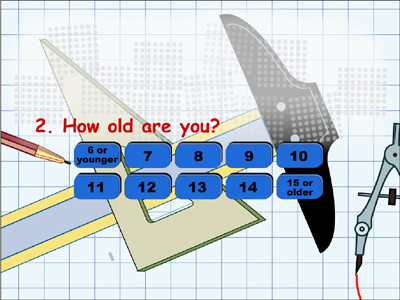
Fig 3: Screenshot from the age demographic data collection portion of the game
Analysis of Collected Data
Due to some administrative issues, including a turnover in the leadership at the Ann Arbor Hands-On Museum, the Web version of Design Station that includes the new data collection routines is not yet available on-line, although a non-research version of just the game itself may be found on the ERC/RMS Web site (http://erc.engin.umich.edu/museum). Because the data we will collect from the research version of the Design Station Web game will be identical to the data collected from the version of Design Station found on the Ann Arbor Hands-On Museum floor, we have included results from an analysis of over 6,000 uses of the game as a demonstration of the types of analyses possible with data collected from the research version of the Web game.
Sample Results
Demographic group performance
We observed some gender differences amongst our subjects: more females than men played the game, 57% to 43%: a trend that held across virtually all age groups (see Fig. 4).Interestingly, females scored significantly better on the in-game pen design task as compared to males (with means of 68 to 65 and standard deviations of 20.2 and 20.3, respectively, a t statistic of 4.89 and a two-tailed tcrit of 1.96). Because we were concerned with designing a game that appealed equally to women as to men, these results indicate that we surpassed our goal.
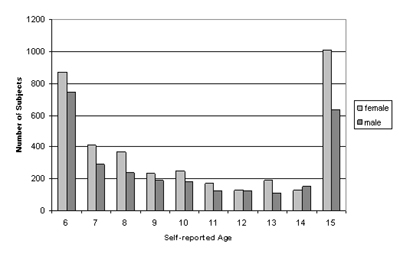
Fig 4: Distribution of self-reported gender across self-reported ages. More females than males played the game in virtually all age categories
Implications for future game design
From our analysis of the physical exhibit data, we can see that the information we are collecting provides an interesting view of the users' experiences. A surprisingly large number of visitors, nearly half at 48.2%, are playing the game to completion (defined as any stage from the score screen until the credits, see Fig. 5). This is quite an achievement for a game placed on the floor of a busy science museum, and it will be interesting to see if the percentage will be even larger for the Web audience. Even so, it is an examination of the 'early quitters' that really provides some interesting insights into the game. For example, we see that the largest spike of people abandoning the game prior to completion occurs at the final stage of three screens of text-based instructions, intro_marketing_3, near the beginning of the game.
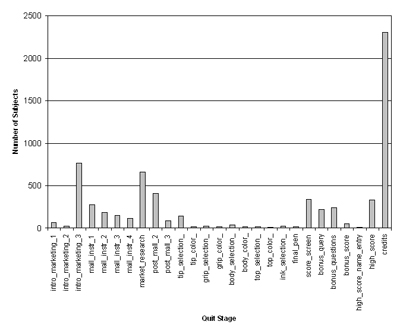
Fig. 5: A histogram depicting the number of users who chose to quit during each of the stages of the game. The stage displaying the credits was by far the single most popular place to quit, but spikes also appear at 'intro_marketing_3', which is the last of three test-based instruction screens, and at 'market_research', which is the stage where the users interview people at a mall about their preferences in pens.
One of the debates we had in designing the game concerned the length of the instructions – namely, we were concerned that users would be 'turned off' by having to read instructional screens prior to engaging with the game more interactively. We settled on three introductory instruction screens wherein the primary activity is reading the instructional text. We discovered that barely any of the users who quit during the three initial instruction screens quit during the first two pages of instructions (about 10% combined – 66 subjects for the first screen, 28 for the second). The remaining 90% (765 subjects) quit on the third page, after the interactive task had been fully explained and was about to begin. A likely hypothesis is that the users who chose to quit at this point did so because the interactive task, as described to them by the instructional screens, did not seem appealing. By contrast, it does not seem likely that the users were put off by the requirement of reading the instructions, or there would be a more even spread of quitters across the three instructional screens, with an increasing attrition rate from the first to the third screen. From this we can conclude that our instructional screens were not unduly taxing for the readers we can make use of a similar strategy in future games. (Although it might be informative to discover what aspects the subjects found distasteful – perhaps something in the explanation of the task caused the subjects to opt out of the game before trying it).
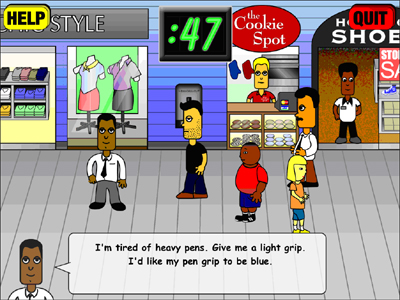
Fig 6: Screenshot of mall interview scene, from which many subjects chose to quit prematurely
Another interesting lesson learned from the early quitters concerns the two main activities in the game. Given the number of distractions in the museum exhibit setting, one would expect the attrition rate to increase with the linear progression of game stages. This is not the case, however: over twice as many users quit during the first interactive activity, the market research scene ,denoted 'market_research', as in the second activity, the pen design phase, which is made up of the 10 stages from 'tip_selection' to 'final_pen'. It is clear that something about the latter activity was more appealing than the prior activity, information we can use in designing the activities for the other two manufacturing education games.
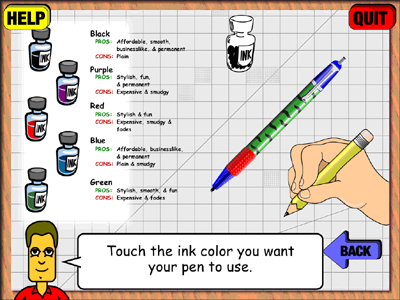
Fig 7: Screenshot of one of the pen design scenes, from extremely low numbers of subjects who chose to quit
A correlation check across the game scores, time spent playing the game, and the number of clues discovered and utilized by the subjects shows that our game scoring reflects in-game behaviour appropriately (see Table 1). This is an important finding, because it is very possible to build a piece of "educational software" that has a veneer of educational content, but whose gameplay mechanics contain nothing that intrinsically leads to deeper learning. For example, a memory card game whose images are dinosaurs still trains a subject more on their spatial memory skills than it expands their knowledge of dinosaurs. With our game, subjects who spend more time collecting good market research (called clues) and making use of those clues in designing a pen score better in the game than subjects who do not engage in such behaviors. This teaches an essential lesson about what it means to conduct market research.
| Correlations between collected data dimensions | ||||
|---|---|---|---|---|
| gameplay
time |
game score |
%
of clues revealed |
%
clues user used |
|
| gameplay time | 1.000 | 0.354 | 0.328 | 0.285 |
| game score | 1.000 | 0.492 | 0.911 | |
| % of clues revealed | 1.000 | 0.534 | ||
| % clues user used | 1.000 | |||
Table 1: Correlation table. Correlations with significance are denoted with bold text. The positive correlations of the gameplay time with the game score, percentage of clues uncovered by the subjects, and percentage of revealed clues utilized by the subjects validates our game design. Essentially, it confirms that the longer the time subjects spend with the game, the more likely they are to uncover useful information and apply it to obtain higher scores.
Future Work
There are still many open questions to be answered. For example, how honestly do people report their personal information on Web surveys? Some early research indicates that people are, surprisingly, more likely to be honest with computer surveys than traditional paper surveys (Weisband & Kiesler, 1996). Since this study was conducted in the early days of the Web, the findings may no longer hold. In which case, what claims, if any, can we make about our collected self-reported demographic data? Now that we are poised to release our data-collecting game on the Web, how can we ensure that it will get the traffic we would like? It will be interesting to see how the self-reported demographics compare to those collected in the museum, and to see if there are other differences between the museum and Web audiences.
The more interactive the medium, the greater the number of dimensions its success and failure will be judged along. Many entities with a Web presence are commercial in nature, and market forces help judge the success or failure of their efforts to deliver interactive media to consumers. For institutions with an educational mission, like museums, it is critical that they be able to gauge the degree to which their interactive media target the appropriate audiences and fulfill their educational aims. It is clear that even with the standard statistical analyses we performed, there is a vastly richer understanding to be found with collecting more detailed data on subjects' experiences with interactive media than what is available from server logs alone. And yes, there is still room for more: there are entire dimensions of the interactive experience that are not being captured by our existing system. For example, we are collecting no data that allows us to make inferences about the affective experience the subjects are having with our game – are the users enjoying themselves? In balancing the need to provide an enjoyable experience with the need to conduct research, we nixed the initial plan to present subjects with a pre-test and a post-test of subject knowledge. Might there be other ways, though, of gauging subjects' existing knowledge, perhaps by integrating it into an interactive mini-game? In exploring the possibilities interactive media provide us, the museum community will surely evolve new and interesting ways of conducting user assessments.
In producing Design Station for distribution on a museum Web site, we have encountered problems and come up with provisional solutions for many, regarding : software engineering issues, ethical issues, and privacy issues. It is our hope that others may learn from our decisions, and expand upon our development efforts. It would be foolish, after all, not to take advantage of the opportunities for study that the information age has opened to us.
Acknowledgements
The authors would like to acknowledge all of those who worked on the ERC/RMS museum project: Chris Milas, Jen Beyer, Steve Day, Adam Dumas, Tim Hong, Tony Fugolo, Ian Krieg, Tyler Nordstrom, Benjamin Olabisi, John Priskorn, Staci Washington, and Vicky Tao. The authors would like to thank the staff of the Ann Arbor Hands-On Museum for their continued advice and support.
References
Andrews, D., B. Nonnecke, & J. Preece (2003). Conducting Research on the Internet: Online Survey Design, Development and Implementation Guidelines. International Journal of Human-Computer Interaction 16(2), 185-210.
Baker, D. (1993). I am what you tell me to be: Girls in science and mathematics. In R. J. Hannapel (Ed.) What research says about learning in science museums Vol. 2, Washington, DC: Association of Science Technology Centers, 30-34.
Bertot, J. C., C.R. McClure, W.E. Moen, & J. Rubin (1997). Web usage statistics: Measurement issues and analytical techniques. Government Information Quarterly, 14 (4), 373-395.
Burton, M., & J.B. Walther (2001). "The Value of Web Log Data in Use-Based Design and Testing." Journal of Computer-Mediated Communication 6(3). Consulted January 27, 2005. http://www.ascusc.org/jcmc/vol4/issue4/adams.html
Carlisle, R. W. (1985). "What Do School Children Do at a Science Center?" Curator 28(1), 27-33.
Catledge, L. D., & J.E. Pitkow, (1995). "Characterizing Browsing Strategies in the World-Wide Web." Computer Networks and ISDN Systems 27, 1065-1073.
Goldberg, J. (1995). Why web usage statistics are (worse than) meaningless. Last updated July 17, 2004, consulted January 27, 2005. http://www.cranfield.ac.uk/docs/stats/
Kaynar, I., Z. Pasek, & L. Lyons (2004). Creating an Informal Engineering Education Experience: Interactive Manufacturing Exhibit. International Conference on Engineering Education, Gainesville, FL, USA. Consulted January 27, 2005. http://succeednow.org/icee/Papers/286_ICEEpaper_final_(4).pdf
Martin, D., H. Wu, & A. Alsaid (2003). "Hidden surveillance by Web sites: Web bugs in contemporary use." Communications of the ACM 46(12), 258-264.
Sandvig, C. & E. Murase (2000). Social Research Through the Unobtrusive Observation of Network Traffic: Methodological and Ethical Challenges. The First Conference of the Association of Internet Researchers, Lawrence, Kansas, USA. Consulted January 27, 2005. http://aoir.org/members/papers/Sandvig_Murase--AOIR_Paper_2000.pdf [password required]
Thomas, J. (1996). "Introduction: A Debate about the Ethics of Fair Practices for Collecting Social Science Data in Cyberspace." The Information Society 12(2), 107-117.
Weisband, S., & S. Kiesler (1996). Self Disclosure on Computer Forms: Meta-Analysis and Implications. CHI 96 Conference on Human Factors in Computing Systems. Vancouver, BC, Canada: 3 - 10. Consulted January 27, 2005. http://portal.acm.org/citation.cfm?doid=238386.238387
Cite as:
Lyons, L and Z. Pasek, Beyond Hits: Gauging Visitor Behavior at an On-line Manufacturing Exhibit, in J. Trant and D. Bearman (eds.). Museums and the Web 2005: Proceedings, Toronto: Archives & Museum Informatics, published March 31, 2005 at http://www.archimuse.com/mw2005/papers/lyons/lyons.html
April 2005
analytic scripts updated:
October 2010
Telephone: +1 416 691 2516 | Fax: +1 416 352 6025 | E-mail: