
Nicoletta Di Blas and Caterina Poggi
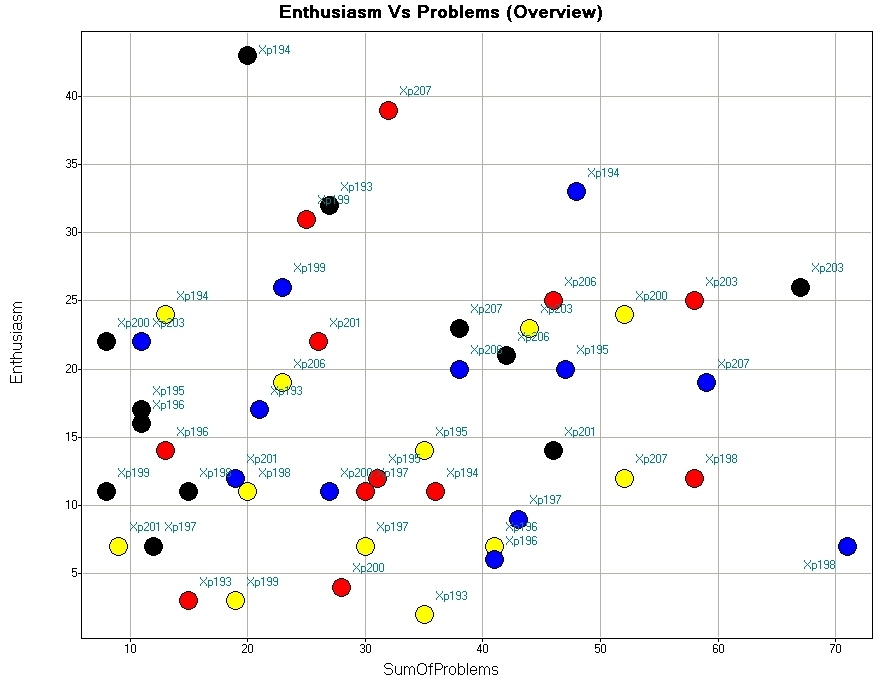
Fig. 3: Spotfire chart showing the relation between tech failures and excitement. Every spot represents a session: the x value is the number of chat messages mentioning problems, the y value those denoting enthusiasm
Return to Paper