Phyllis Hecht, National Gallery of Art, USA
http://www.nga.govAbstract
Last year the National Gallery of Art in Washington, DC, undertook a five-month research project to evaluate its Web site. Working with a user-experience firm based in San Francisco, we gained a better understanding of who visits the National Gallery's Web site, why they come, and their expectations once they are on the site.
Several different kinds of investigations were undertaken to achieve the project's goals:
- interviews with core stakeholders inside the Gallery
- an on-line user survey, to understand who the users are and what they expect
- a ‘freelisting’ exercise, to provide a picture of all the activities that users wanted to perform on the site
- remote usability testing, to discover how well users were able to interact with the current site and find what they needed
This paper reviews the first three methods and discusses a summary of results of the entire project, but concentrates on the final phase of the research, which involved ‘remote usability testing.’ This research involved a Web-based method of testing, rather than a usability lab, and it allowed us to recruit participants from widespread locations to observe their screen movements “live” as they attempted to accomplish tasks on the site.
The site evaluation yielded a wealth of data that will be used to make improvements in the design of the Gallery's Web site as well as to make the site more responsive to our users' needs and expectations.
Keywords: museum Web site evaluation, usability, user research, remote testing, survey
Introduction
The National Gallery of Art Web site (http://www.nga.gov), launched in February 1997, is a key vehicle in carrying out the Gallery’s mission. As such, it is the first point of contact for some Gallery visitors and the only connection for those who will never visit Washington, DC. The Gallery’s Web site is continually growing with the addition of educational content, interactive activities, images of art objects, and new tools to communicate with our audiences. Over the years the Web site structure has expanded incrementally, each new content addition being fitted into the existing design and architecture. As we continued to add new sections, we began to identify the various challenges inherent in a large site, and in 2003 we began in-depth planning for the future growth of the Gallery’s Web site. One of the initial goals we set out for ourselves in the strategic plan was to undertake a full-scale evaluation of the Web site.
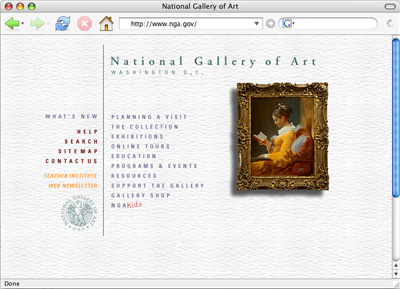
Fig 1: Home Page of the National Gallery of Art, Washington, http://www.nga.gov
A significant amount of pre-planning occurred before the evaluation could begin. Approvals from the Gallery’s Web Advisory committee and the IT Steering Committee were required to secure funding for the project. Documents describing the Gallery’s Web site audiences, known site deficiencies, and goals for the evaluation were drawn up. A request for proposals was distributed, and Adaptive Path, a user-experience firm based in San Francisco, was hired to lead us through this comprehensive evaluation. EaseAbility of Portland, Oregon, and Bolt Peters of San Francisco were hired as subcontractors by Adaptive Path and were instrumental in carrying out specific methodologies. An interdepartmental team of Gallery staff, including Phyllis Hecht, Web manager; Neal Johnson, intranet manager; Donna Mann, senior publications manager, education publications; Judy Metro, editor in chief; Linda Stone, chief information officer; and Deborah Ziska, chief of press and public information, collaborated closely with the contractors on every aspect of the project from start to finish.
Pre-Planning
The overall goal of our evaluation was to discover our audiences’ needs and expectations in using the site. We wanted the results to enable us to restructure and redesign our site for improved usability and increased access to resources through search and navigation, provide easy access to the newest aspects of the site, and attract repeat visitors. We also wanted the results of the study to lead us to a redesigned site with a higher degree of user satisfaction and productivity, and to give us an understanding of how to make it more effective in carrying out the Gallery’s mission.
We created a document of goals for the evaluation, composed of questions regarding details about our audiences, site ease-of-use, navigation, design elements, and responsiveness to our audiences through the Web site. Questions such as the following would help lead us through the evaluation process. Who is using the site? What are they looking for? What are they finding? What factors are impeding more extensive use of the site? Do the links provide enough information to help the users decide where to go next? Is the site easy to read in terms of font sizes, color contrast, and page length? Does our audience feel there is sufficient opportunity for feedback?
Although we had many questions, our own familiarity with the site also led us to identify a number of known site deficiencies and goals for each. Knowing, for instance, that our search function is inefficient and that access to interrelated resources and event information is a challenge, we hoped to understand from the evaluation more about our audiences’ needs and expectations on these specific functionalities and navigation as well as others.
In this pre-planning stage, we also identified ten audiences who we believed were using our Web site. This proved valuable in determining the content and structure of the evaluation methodologies.
Methodologies
Adaptive Path proposed a five-step evaluation plan that began in August 2004. The plan included discovery, site intercept survey, freelisting task analysis, remote usability testing, and vision prototyping. The goal in using the various methodologies was to collect both quantitative and qualitative data and to gather as much research data as possible. Each methodology had a specific goal, one building upon the other, leading to a comprehensive look at our site.
In general, the survey results would be used to understand why people are coming to the site; the freelisting process to develop a map of how people think about using the site; and the usability testing to determine how well the audiences use the current site - what's working well and what needs fixing. This data would then be used in aggregate to guide the design process and help make decisions in the vision prototyping stage.
Discovery
The discovery phase involved interviews of Gallery individuals who are responsible for or invested in the Gallery’s Web site. These stakeholders shared their views regarding how capable the site is of serving the mission of the Gallery, how visiting the site can become a more dynamic experience, and whether the site conveys the unique qualities of the Gallery. These interviews were valuable in understanding in-house perception of how the Web site functions, both in terms of internal workflow and outreach to the public.
On-line Survey
Our next step was an on-line survey, targeted to actual users, for the collection of quantitative data. In order to understand the characteristics of our audiences and the goals they wished to accomplish, the majority of questions - mostly multipart, multiple choice questions - addressed user age, occupation, gender, visit frequency, current and past visit goals, level of interest in art, site satisfaction, and relationship to the physical museum. Several questions included a comment area for the participants to expand upon their choices of response. Branching and skip logic was used in the survey design to allow for separate questions to educators, for example, and fewer questions for those who may have responded “no” to the first in a series of questions. One open-ended question asked respondents to explain in their own words why they might plan to visit the Web site in the future. This information would be used for the freelisting task analysis.
The goals for the survey were to:
- Capture user goals and identify most important ones
- Identify user characteristics
- Generate data around relationship of Gallery attendance and Web site
Visitors to the site were made aware of the survey through a pop-up window and also through a direct link positioned throughout the site. We added the direct link because of our concern that pop-up blockers might limit the availability of the survey, and therefore skew the demographic we would reach. We also did an e-mail blast to our Web site newsletter subscribers asking them to help us make improvements by coming to the site to fill out the survey. The original plan was to collect 400 responses. In the end, however, we gathered 643 completed surveys over the course of twenty days.
Of those who filled out the survey, we discovered that the main motivation for visiting our site was a general interest in art. Finding information on a specific artist or work of art or researching an art historical fact were the main goals visitors hoped to accomplish. Exploring information on current and upcoming exhibitions and planning a visit were nearly as high. The majority of educators reported that they intended to use resources from the Web site to support classroom teaching or to assist in generating their own material. One expanded site feature that many respondents stressed as particularly valuable was the addition of more options to examine works of art in greater detail.
The survey revealed a strong correlation between visits to the Gallery and visits to the site. Using the site to learn about art before a visit and continuing to interact with the art after a visit were perceived as a special value of the Web site. Thirty-three percent of the surveys were completed by first-time site visitors and eighteen percent by those who had visited the site over twenty times. The survey results were cross-tabulated between audience type and task and also frequency of visit to the physical museum and to the Web site. These results were used to accomplish the freelisting task analysis and formed the foundation for the remote usability testing. The results helped assure us that we were focusing on the right audience types and that the appropriate tasks would be represented in the usability test script.
Freelisting Task Analysis
One open-ended question on our on-line survey -“Briefly list why you might plan to visit the National Gallery of Art Web site in the future” - generated a list of possible Web activities from the audience perspective. This list of what people really hoped to do on the site was analyzed and sorted by type of activity. A graphic visualization of how the activities related to one another was created. This mapping of activities would help determine what kinds of information and functionality worked best together, how the navigation should be structured, and how different pages should present information. The results of this methodology would be used for the vision prototyping at the end of the project.

Fig 2: Detail from Freelisting Task Analysis Diagram
Remote Usability Testing
We were now ready for the final phase of the evaluation - direct observation of individuals visiting our site. This fourth component of the project, usability testing, focused on testing navigation, appearance, and functionality of the site. This testing would help us understand how well the current site supported our users’ goals in accomplishing specific tasks. To move forward with this part of the project, our contractor proposed that we use ‘remote’ usability testing rather than the typical one-on-one user testing in a dedicated usability lab.
Remote usability testing, which involves conducting user testing over the Internet, is a fairly new methodology. Although some remote tests were done as early as 1999, it has gained popularity in tandem with the widespread availability of broadband connections. With this type of testing, participants are recruited while they are actually on the site attempting to accomplish a specific task. This ‘passionate task’ is revisited in the testing, allowing observers to see a real-world example of what users might do on a site and how they do it. Other benefits of remote testing include the ability to reach participants in diverse geographic areas, the flexibility of scheduling of interviews, and the test subjects’ ability to participate from their own homes or offices. Remote testing is accomplished with on-line conferencing tools, thereby allowing observers to also be at diverse locations.
Remote testing is not without its challenges and limitations. According to Gough and Phillips (2003),
the most obvious limitation is that you are not in the physical presence of the respondent. You cannot see the facial expressions and other nonverbal cues and it is more difficult to build rapport and trust when you’re just a voice on the other end of the phone.
They also mention that since the testers are in their own environment, distractions by other people or things can be a drawback to this type of testing. The technical aspects of having participants and observers set up and use the conferencing software could also create some challenges during the process, including issues such as screen latency and appropriate audio volume. Also, at the time we were doing our project, connection speeds basically eliminated the testing of users with dial-up connections. However, we felt that the benefits, particularly the opportunity to test a geographically diverse sample of users, outweighed the limitations, and we were enthusiastic about trying this new methodology.
We began by determining the audiences we intended to test and our goals for the usability testing. In consultation with our contractors, we decided to test twenty users. Based on the survey results, we decided to test six member of the general public, five educators, four students, and five children.
The main goals set out for this testing included:
- Identifying what users would like to do on the site as well as what they are there to do
- Learning what users from key audience segments actually do, and how well they are able to accomplish their tasks on the site.
- Measuring how well display of information is working for users to accomplish their goals
- Deciding if the information hierarchy matches what users expect
- Determining if the correct navigation is present at each level
In collaboration with Bolt Peters, we began the process of developing a moderator script. Keeping in mind our evaluation goals and suspected site deficiencies, we constructed task-oriented questions that would take the test subjects to various parts of the site and have them use an array of navigation and site functionality after they first completed the task that they had come to the site to do. A basic script was designed, which included customized questions for each audience type.
While we were creating the moderator script, we were also developing text for the pop-ups that would appear on the site to recruit participants, and also researching privacy and consent issues. According to Diamond (1999),
Researchers have a legal and ethical obligation to make sure that the rights of subjects are protected. …Subjects should always be given sufficient knowledge of an evaluation or other research project to make an informed decision about whether or not they want to participate.
Our recruitment screen made it clear that the interviews would be recorded and that the names of the participants would remain confidential to the contractor and the National Gallery. The recruitment text also stated that the contractor had the right to make its own selection of participants from among the people who volunteered and that those who were selected would receive a gift from the Gallery’s shop. A link to the National Gallery’s privacy policy was also available on the pop-up.
Beyond this disclaimer, we also considered the age of the volunteer. The first question on the recruitment screen asked whether the potential participant was over or under the age of eighteen. For those under eighteen, it was clearly stated that approval from a parent or guardian was required and that the parent or guardian should answer the recruitment questions. Those over eighteen were asked the following questions:
- What are you looking for today on the National Gallery of Art's Web site?
- Are you planning a visit to the National Gallery of Art?
- How would you identify yourself? (Teacher, Student, Other)
- May we call you within the next 7 days to schedule a 30-minute telephone interview?
- Do you have a high-speed Internet connection (i.e. DSL, Cable, T1)?
- Are you visiting this Web site on behalf of your child?
- Name:
- Telephone Number:
- E-mail:
- If you are selected, do you agree to have us record our telephone conversation for the purposes of this study?
Two hundred and fifty eligible respondents answered the recruitment questionnaire during the nine-day period that it was on the Gallery Web site. As the responses came in, Bolt Peters would call potential participants and schedule appointments with those they believed fit the audience criteria that we had set out. The recruitment of adults - eight per hour at first - proved to be fairly quick and steady. However, because of the lag in recruiting children aged twelve and under to test NGA Kids, we changed the wording of the recruitment mid-way through the week to try to attract more parents who would be willing to let their children be interviewed. This change, directly geared to the parents, was successful.
The testing was done on a rolling basis, so an appointment was made as soon as a recruit was considered appropriate. At the agreed-upon time, a phone call, using WebEx conferencing software, was placed to the volunteer. Observers at the National Gallery could also join the meeting by phone through the conferencing software. The observers’ main role was to watch on-line and listen over the phone, with the phone’s mute button activated. Once everyone was on the phone, the moderator explained the test procedure, the roles the participant and the moderator would assume, and reiterated that the test subject’s screen movements and voice would be recorded for the purposes of the study. Interviewee names, of course, would remain confidential and would not be distributed with the information that was gathered. Verbal consent from test participants or from the parent or guardian of those under eighteen was recorded before the usability testing began. Parents were encouraged to listen in on another phone line if one was available or to assist the child as needed.
After this preliminary introduction, the technical set-up began. The participant was asked to download the WebEx software to allow for computer screen sharing. Most participants had no difficulty with this procedure. While the software was downloading, the moderator asked background questions regarding the participant’s relationship to the physical museum, to the Web site, and what they expected to find on the Web site.
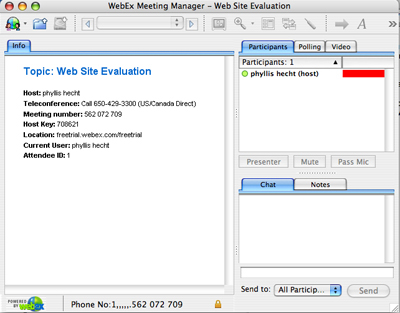
Fig 3: WebEx Conferencing Interface
Once the screen sharing was activated with WebEx, the task-oriented portion of the script began. Participants were asked to think aloud as they were moving through the site trying to accomplish the task. The first task was always the ‘passionate task,’ or what the person had actually come to the site to do. Approximately fifteen tasks or questions followed, some of which were geared to specific audiences. A teacher might be asked about finding resources for use in the classroom, while a student was asked to pretend to find something for a homework assignment. Several optional questions were created for the script in anticipation of the interview’s veering off in particular directions, and the observers had the option of instant messaging the moderator if an opportunity for a new direction of questioning revealed itself. This factor was an additional benefit to using this Web-based methodology.
Technology challenges arose at times during the testing, as occasionally the screen movement would lag behind the audio due to a slow Internet connection, or the audio was imperceptible to the observers. Despite these issues, it was a fascinating experience having the moderator on one coast, observers on the other, watching and listening to a visitor in perhaps Michigan or Tennessee.
The participants in the testing had come to the site for as diverse reasons as finding information on a particular Dutch painting or exploring whether the Gallery offered rental space for events. The results of the testing showed that our site was particularly successful in satisfying our users’ needs for visit planning and exhibition information, educational resources, activities for kids, and informing children about art. Our users also found that the site provided overall valuable information. On the other hand, our users were looking for more images of works of art, a more intuitive search capability, and easier access to interrelated resources. Although it is possible to search the site for images only by a particular artist, most users who were tested did not find that option. Visitors who had been to the museum found a gap between the museum and Web site experiences. They did not feel that it was as easy to browse the Web site to find art they wanted to learn about, as it was to wander among the physical galleries. Other findings identified navigation difficulties between specific sections of the site as well as the need for better navigation from deep within a resource to other areas of the Web site.
Videos were captured of each user session, making it possible for the Gallery project team to study these usability tests in-depth. Watching and listening to our users’ successes and frustrations as they navigate our site has been invaluable in helping us develop our future content and design plans.
Vision Prototypes
When all of the field-testing for the evaluation project was complete, a document of future site requirements was drawn up from the results of all the methodologies employed. This document included strategic and functional recommendations. Using this document, the contractors facilitated an interdepartmental team of Gallery Web developers and designers, along with the core project team, in the creation of vision prototypes for some of the main pages on the Web site. The sessions resulted in detailed wireframes of five main pages that will serve as the foundation of the full-scale restructuring and redesign of the Gallery’s Web site.
Conclusion
“Evaluation is less about data collection than it is about immersion” (Diamond, 1999). The collaboration among interdepartmental Gallery staff, the close working relationship with our contractors, and the total immersion into our site from the users’ perspective led to a successful outcome of this evaluation project. Since the project ended, several navigation issues have been resolved, one site search difficulty has been remedied, and a content development plan has begun. Although there is always more to learn and evaluation must be an ongoing process, we all feel that we now understand the site much better from our users’ point of view and are enthusiastic about the next phase of development.
References
Diamond, Judy (1999). Practical Evaluation Guide: Tools for Museums and Other Informal Educational Settings. Walnut Creek, CA: Altamira Press.
Gough, D. and H. Phillips (2003). Remote Online Usability Testing: Why, How, and When to Use It. http://www.boxesandarrows.com/
Cite as:
Hecht P., Viewing The Viewer: Remote Usability Testing, in J. Trant and D. Bearman (eds.). Museums and the Web 2006: Proceedings, Toronto: Archives & Museum Informatics, published March 1, 2006 at http://www.archimuse.com/mw2006/papers/hecht/hecht.html