Judy Haynes and Dan Zambonini, Box UK Ltd, UK
Abstract
As the capabilities, social attitudes and requirements of Web site visitors change, so must our approach to analysing their use of on-line museum resources. We can no longer rely on rudimentary page view statistics to gauge success and failure, but instead must devise new methods for measuring and assessing the actual behaviour of museum Web site visitors.
In this paper, we use detailed visitor click-data from five leading museum Web sites to present and discuss generic patterns of user behaviour. A typical 'profile' of a museum Web site visitor is also constructed from the data, and contrasted with that of a typical – non-museum, generic Web site – visitor.
Keywords: analytics, usability, user behaviour, information architecture, clickdensity
Introduction
Almost immediately after the introduction of the first Web browser in 1993, organisations and private individuals started to collect and analyse data on how their visitors used their Web sites. As the Web became an increasingly important medium for business in the years that followed, Web analytics evolved from simple page counters, through graphical reports, to intelligent prediction engines.
In recent years, we have witnessed a turning point for Web analytics. Changes in technology and social behaviour on the Web have reduced the relevance of standard Web statistics. With the growing popularity of AJAX (updating Web pages without a page refresh), user-generated content and RSS (distributed content), the basis of page views and Web site sessions for Key Performance Indicators (as used by the UK government for Museums, for example) is becoming increasingly problematic.
As the difficulty of measuring quantity of content consumption increases, and the measure of success on such metrics decreases, attention is being re-focused on the higher level issues of usability, accessibility and information architecture. Paradoxically, improvements to usability and information architecture often further reduce the measurements originally used for success, with a typical reduction in page views and session times as users are better able to find the information they seek.
Usability, however, is notoriously difficult to measure; focus groups and visitor surveys are often employed to estimate some quantifiable measurements of ease-of-use. Collecting similar data automatically on Web sites is an even tougher proposition, although some important measures of usability can be deduced through the analysis of how users behave on the site: what, where and when they click.
Measuring and Analysing Visitor Behaviour
For this research, we used clickdensity (http://www.clickdensity.com), an on-line tool that can be used to study user behavioural data, to analyse a number of museum Web sites. Together with standard Web analytics data (date-time, browser, platform, screen resolution, etc.), clickdensity collects specific on-line 'behaviour' data such as the exact X/Y co-ordinate of every mouse click on a Web site and the time elapsed between each click. This information can be presented in a variety of forms, including heat maps showing hot spots on a page. Armed with this information, we can begin to analyse the trends and patterns of visitor behaviour, and hence usability.
The following museums kindly participated in data collection for this study: the Imperial War Museum (http://www.iwm.org.uk), Museum of London (http://www.museumoflondon.org.uk), Powerhouse Museum (http://www.powerhousemuseum.com), San Francisco Museum of Modern Art (http://www.sfmoma.org) and the Science Museum (http://www.sciencemuseum.org.uk).
The data presented in this research is taken from the week of Saturday 20th to Friday 26th January 2007. During this seven-day period, 300,654 clicks were recorded from 104,524 user sessions across selected pages from the five museums.
Who Are The Visitors? What Do They 'Look' Like?
Before analysing visitor behaviour on the museum Web sites, we can construct an average profile of a museum Web site visitor, and compare this to the typical profile of a non-museum Web site visitor. For comparison purposes, we have selected 2000 non-museum Web sites (hereafter 'Standard' Web sites), which over the same date-range produced 4,886,281 clicks from 3,601,086 sessions. These Standard Web sites cater to a varied audience, from financial Web sites to national newspapers, supermarket chains to high-street retailers, global travel agencies to long-tail niche sites (such as one supplying toupees for babies).
Comparing the platform and browser combination of Museum sites and Standard Web sites (Figure 1), we find that nearly twice as many Museum visitors use Firefox on a PC (10.4% of users, for both versions) as Standard visitors (6.4% of users).

Fig 1: Platform and Browser make-up of the Museum and Standard Web site groups
Similarly, the Museum visitor is five times as likely to be a Mac user (9.2%) than a Standard visitor (1.8%), and of the Mac users, five times as many use Safari (7.8%) than Firefox (1.4%). Although Museum and Standard Web sites share similar percentages of PC/Internet Explorer visitors at versions 5.5 and 6, far fewer Museum visitors are using version 7 (22.1%) than Standard visitors (36.9%).
The differences in screen resolutions (Figure 2) are negligible, with the small differences largely attributable to the number of Mac users in each group.
Fig 2: Screen Resolutions of Museum and Standard Web site visitors
Examining how the visits break down by day of the week (Figure 3), we find that the typical distribution curve (busy mid-week, quiet at weekends) is indeed followed by Museum Web sites, but with a flatter curve than Standard. The mid-week museum peak accounts for 19% of visitors - compared to 22.5% of Standard visitors - and museum Web sites attract twice as many visitors at the weekend than Standard Web sites, in terms of their percentage of visits.

Fig 3: Percentage of visits per day of week, of Museum and Standard Web site visitors
What Are The Visitors Doing?
The most clicked-on area of a museum home page is the Visiting/Opening Times section (an average of 17% of all museum home page visitors click on these links), so we will first turn our attention to this section. These links also tend to be those that are clicked the quickest (i.e. the least time between the page loading and the user clicking on a link); this could be due to a combination of the visitors knowing exactly what they are looking for, and the prominent positioning of such links on the page.
How Visitors use the Visiting section on Museum Web sites
Predictably, maps are the busiest areas of Visiting sections. On average, 28.5% of all clicks in these sections occur on links to maps, with this figure increasing to just over 50% for sites with a choice of detailed map links. However, even on sites that provide a range of map options, our click analysis shows that a significant number of visitors still copy and paste postal codes and street addresses from museum address text on the page.
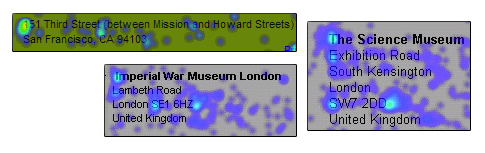
Fig 4: Evidence of users clicking either side of addresses, to copy and paste
The reasons for visitors copying and pasting addresses and postal codes is unclear; they could be more comfortable with a specific mapping tool than the one provided, or perhaps they need directions from a greater distance than existing directions provide, or perhaps they are searching for hotels in the area. In reality, it is likely to be a combination of these, and much more. As it is unlikely that a museum will be able to satisfy all of these requirements with additional hyperlinks and information, it is recommended that the museum address (including postal/zip code) always be made available on these pages.
Even though it might not be possible to satisfy all of the diverse mapping requirements of visitors, museum Visiting sections generally do seem to satisfy most questions regarding visitor information; on average, only 0.7% of clicks from this section are made in the search box (compared with an average of 4.8% of home page visitors who use the search facility, or 3.4% of Exhibitions page visitors).
Once a user has obtained their information about locating and travelling to the museum, the next most popular links are for Exhibitions, Galleries and Events; i.e. “I know how to get there, now tell me what I can see and do”. It is Events Calendars that we shall turn our attention to next.
How Visitors use Events Calendars on Museum Web sites
An events calendar is a common way of allowing users to view the activities for a particular day. The research data shows some clear trends in user behaviour when using the calendar.
The calendars offer consistent functionality across sites:
- The ability to view the next month’s events
- The ability to view the previous month’s events
- The ability to click on a date (from the current month) to see that date's events
The data for this research was collected from the latter part of January. It is therefore unsurprising that there are a large number of clicks to browse the next month (February), with very little use of the previous month (December).

Fig 5: Visitors check for events in upcoming months, but not previous months
Weekend Visitor Behaviour
At the weekend, visitors tend to use the calendar to view the current weekend’s events.
![]()
Fig 6: A calendar heat map for Saturday 20 January, showing that most weekend visitors are interested in the current weekend, rather than planning ahead
On a Monday and Tuesday, users view the events for the coming week almost equally.
![]()
Fig 7: A calendar heat map for Tuesday 23 January, with clicks spread evenly over the week ahead
As the weekend approaches (from Wednesday onwards), the clicks on the weekend dates (Saturday in particular) start to increase.
![]()
Fig 8: A calendar heat map for Wednesday 24 January, with increasing clicks for the coming weekend
In summary, the heat maps appear to show that during the week visitors use the Web site to plan for future visits, but at the weekend they are more concerned with imminent visits (for the same weekend). This could imply that there are two types of user: the organised forward thinker, and the more spontaneous (weekend?) visitors.
The Home Page
Usability best practice recommends that Web sites include a link to their home page as part of the core template - a guideline that was followed by all of the museum Web sites in our sample. This, however, presented an interesting usability issue of its own. Whilst analysing the click behaviour over time for the homepages in the data sample, we noticed that during the first 5 seconds on the page a significant proportion (up to 14%) of users clicked the 'home' link (Figure 9). This would have the effect of reloading the current page and causing possible confusion or annoyance to the users.
We also noticed that sites with a more graphical home page (less “text-heavy”) seemed to suffer less from this problem than those sites that offered little distinction between their homepage and subsequent ‘content level’ pages. This effect could therefore possibly be caused by users coming to the home page of the site through a search result (or other external link), and not realising their location within the site structure, clicking the ‘home’ link to request the main page. If this is the case, a more structured, holistically designed home page could reduce this statistic.
Searching from the Home Page
Apart from the home page link, the other home page element that receives increased usage in the first five seconds is the search facility (Figure 9). On average, 10% of the users who click within the first second of arriving on the home page will carry out a search. This falls to approximately half this value for the users who take longer than a second to act.

Fig 9: How visitors use various home page elements over time
During the first five seconds (when the search is used most heavily), it is unlikely that the visitor has had the opportunity to scan the entire home page for the information required. It is therefore more likely that this direct route to the search facility is not caused by poor information architecture or prioritisation of information on the page. Rather, it may be that Web users are extremely comfortable with the process of ‘keyword searching’ (rather than browsing) for information (for example, because of their high success rate when using Google), so they therefore choose this method immediately. Search boxes also tend to be highly visible, recognisable, and positioned in predictable locations (top right, or to the left), allowing these ‘power users’ to identify their preferred route quickly (i.e. within the first five seconds).
How Long Before They Click?
If we no longer look at clicks on specific elements, but rather the average times when visitors click on the home page (irrespective of what was clicked on), we find the distribution curve in Figure 10.

Fig 10: Distribution of when users click on the home page
This curve shows a peak (of visitors clicking) at about 2-3 seconds after page load, with a ‘long tail’ that eventually extends to many hundreds of seconds. Although the four museums plotted exhibit a similar shape, it’s worth noting that the two museums with the smallest initial peak and tallest tail (museums 2 and 4) – that is, the museums where users tend to not click as quickly on the home page – are the museums with the least text and most graphics (i.e. the more ‘design-led’ rather than ‘content-led’ home pages). Common wisdom would seem to suggest that visitors would spend more time on content-heavy home pages, which tend to have many options (and therefore require longer to read), but this evidence suggests otherwise. Perhaps visitors can find their required information faster on content-heavy pages, or perhaps visitors spend longer admiring the imagery on ‘design-led’ home pages before clicking?
Generic Behaviour
In addition to the above, we can also present a number of generic patterns of user behaviour detected across the (museum) sites.
Possibly as a consequence of Fitts’ Law (http://en.wikipedia.org/wiki/Fitts'_law) and the shape of computer mouse pointers, visitors tend to click in the horizontal centre of links, slightly towards the bottom of links, towards the bottom-right of buttons, and in the left of empty text boxes (Figure 11).

Fig 11: Where visitors click on links, text boxes and buttons
With regards to the type of object that visitors click on, approximately 90% of all clicks are on hyperlinked elements (text, images, etc.), 9.5% are on form fields (text boxes, drop-down boxes, etc.), about 0.3% are on multimedia objects (including embedded Flash), and the remaining 0.2% are on non-hyperlinked areas (plain text, background, headings, etc.). This is in stark contrast to our previous research (http://www.clickdensity.com/viewpost.aspx?PostID=46), which found (from about 2000 non-museum Web sites) that only about 60% of clicks were on hyperlinks, about 35% were on form fields, nearly 3% were on multimedia, and just over 1% on non-hyperlinked areas (Figure 12).

Fig 12: What users click on, for museum and standard sites
This contrast is almost certainly because museum Web sites are more ‘content-rich’ than the average Web site, with deeper and more frequent hyperlinks.
Summary and Conclusions
By measuring and analysing new types of data, such as ‘click time’ and ‘click coordinates’, we are able to better construct assumptions about user behaviour on museum Web sites. This data was collected for five leading museum Web sites and analysed for generic patterns of user behaviour.
We found a distinct difference between museum and ‘Standard’ Web site visitors, noticeably in museum sites’ increased use of Macs and PC/Firefox. We also found that museum Web sites attract a larger percentage of their audience at weekends (compared to Standard Web sites), and also have a much higher percentage of clicks on ‘hyperlinks’ than Standard Web sites.
The Visiting sections are undoubtedly the most popular sections of museum Web sites, and although maps are the most commonly requested link within these sections, a large number of users still copy and paste the museum address for their own mapping purposes.
Within Events Calendars, we found two distinct modes of use: visitors during the week were interested fairly equally in the next seven days, whereas weekend visitors were primarily interested only in the current weekend.
Graphical home pages were found to be potentially less confusing for referred visitors, with fewer clicks on the ‘home’ link, but users also tended to wait slightly longer on these graphical home pages before making a decision to click.
In conclusion, analysing the use of museum Web sites - and importantly the reasons for such use - is a necessary but complicated process. This type of analysis provides a fascinating insight into such user behaviour. As with all Web analytics, it provides a set of hypotheses, rather than hard and fast rules. These suppositions can be easily tested on individual Web sites, with even small changes potentially having a significant impact on usability.
Cite as:
Haynes, J., and D. Zambonini, Why Are They Doing That!? How Users Interact With Museum Web sites, in J. Trant and D. Bearman (eds.). Museums and the Web 2007: Proceedings, Toronto: Archives & Museum Informatics, published March 1, 2007 Consulted http://www.archimuse.com/mw2007/papers/haynes/haynes.html
Editorial Note