
Background
Media studies academic Henry Jenkins famously declared that in the digital realm, "if it doesn't spread, it is dead" (Jenkins, 2009). And as Clay Shirky, discussing the future of newspapers, asserted late in 2009, "public reuse produces a kind of value that doesn’t just come from publication. It comes from republication and reuse" (Shirky, 2009).
It also comes at a time when there is serious discussion about the role of museum collections on-line and the historical legacy of what Finnis (2009) terms ‘showcase sites’. In her definition showcase sites
target young people in exciting and innovative ways – sites that can go live with a big splash, a big marketing budget and an ambition to target an identified need in a focused way . . . Their focus on lively design, animation, games, sound and fun stuff is appealing, well understood and works. Lots of museums understand this point well as the process is similar to staging an exhibition . . . [but] rather like the museums’ own websites, it creates yet more islands and walled gardens that do not join up . . . and there is often a big problem with their sustainability.
(Finnis, 2009, p86)
Complicating this further, the Australian education sector has to pay for the right to copy material under the Statutory License part VB of the Australian Copyright Act 1968, and unlike other jurisdictions, Web content is included in the definition of ‘material’. This has been shown to act as a significant deterrent to schools using Web content in classrooms unless they can be certain that it has been exempted from the license (Browne, 2009). License fees for the copying, printing or distributing of (freely available) on-line resources in educational institutions are collected by the Copyright Agency Limited (CAL), a non-profit collecting society. This was one driver for establishing The Learning Federation (TLF) as a repository of CAL-exempt educational materials. (The Learning Federation manages the national resource pool and infrastructure of digital curriculum resources. These resources are aligned with the curriculums of the Australian states and territories.)
The Study
In order to start to determine whether collection data is worthwhile being actively promoted as ‘spreadable,’ this paper explores the differences between collection ‘viewers’ and ‘re-users’ using data collected from the Powerhouse Museum over a 25-week period between July 2009 and January 2010.
First, it examines the behaviour of general viewers of the on-line collection together with that of ‘cut and pasters’. Second, it looks at the subgroup of users of the collection from the NSW Department of Education - all Government primary and secondary schools in NSW. In so doing, it aims to reveal the different patterns of use and interest to provide a point from which to be able to better decide on future strategies.
Unintended Uses
Apart from the dominance of Google Search in delivering traffic to our Web sites, museums know that Google Image Search is a big driver of traffic as well. With access to reliable Web analytics, museums find that the top three referrers of traffic to their Web sites are Google Search, Google Images and Wikipedia - in that order.
Likewise, there are unpredictable viral effects that occur, such as the re-use of 18th century French painter Joseph Ducreux’s self-portrait which became the secret ingredient of the 'archaic rap' meme (see http://knowyourmeme.com/memes/joseph-ducreux-archaic-rap). Overlaid with re-written lyrics from commercial hip hop and rap, the meme has spawned thousands of variants. I do not expect that the Getty, which holds the original work from 1783 that is used in the meme, is all that excited (if they even are aware), despite the wide re-use of the image.
Jane Finnis, writing about the experience of UK cultural publishers and aggregator Culture 24, writes that what used to be almost always 'out of context image hijacking' is starting to change with more 'in context use' through a proportional increase in image embedding by cultural bloggers and on-line publishers (Finnis, 2008, 154-160). This may, however, simply be a result of a growing awareness of Culture 24 as a site full of relevant image content and a subsequent growth in intentional site visitors compared to casual visitors.
Even in the Powerhouse Museum collection, there was some initial surprise at discovering that a dress worn by a pop star was suddenly the most popular object in the on-line collection for a while (Chan, 2007).
None of this was intended. This is not to say that incidental or long-tail traffic is not important. It clearly provides opportunities to connect with new audiences - the success of the Commons on Flickr (Springer et al., 2008), and the traffic to multi-institutional repositories such as Europeana are all indicators of this 'latent demand'.
However, designing for these unknown audiences would be a very difficult task, and it would divert attention away from less exciting but more fundamentally critical users of museum content.
Tracking the Use We Design For
Public museums all desire to make their content available to the education sector. It is usually the cornerstone of their public mission; however, it has often had mixed success. Peacock, Tait and Timpson (2009) write:
the failure to establish effective and well targeted digital distribution systems for museum content is particularly apparent and regrettable in the case of school-based users, or potential users, of museum digital content and services. It represents a major unfulfilled opportunity to develop new markets, products and services and to transform institutional practice for the digital age.
In recent years, governments have rolled broadband Internet connectivity to schools, and some are now experimenting with providing laptops. All the while, museum content seems to still be worryingly underused by primary and secondary school students.
On one hand, there has been a lot of effort developing 'educational' games and microsites for content specifically authored for school visitors - Finnis’ ‘showcase sites’; but on the other hand, little attention has been paid to how these same school visitors might use the increasing volume of 'collection data' available on museum Web sites.
On the museum side, there have been attempts such the UK's National Museums Online Learning Project (NMOLP) to repackage, re-author and provide access to a subset of museum collections (Royston, 2009) as well as the projects in Canada and Australia described by Peacock, Tait and Timpson (2009) .
Falling between ‘showcase site’ and basic collection access, these inevitably have come at considerable additional resource cost to institutions and financial cost to the public. At the same time, each project has necessitated an additional layer of 'interpretation' required to 'translate' and 'contextualise' collections for 'different audiences'. Unfortunately, this has quickly become another burden to balance against the ongoing need for basic cataloguing and digitisation (Royston, 2009; Bain, 2009).
The Powerhouse Museum took part in one of these projects in 2009.
The Learning Federation's (TLF) pilot project - the Museum & Education Digital Content Exchange - took 643 collection records from three museums and explored their use within primary and secondary schools in several Australian jurisdictions. Metadata was harvested from each institution and ingested into Scootle, a learning portal operated by the TLF. The harvested data then connected teachers and learners back to the museums' own Web sites for object records. (After the in-school evaluations the collection records contributed by the three museums increased to over 2,000, and they remain accessible through Scootle).
As collection documentation has historically been written primarily for internal and research use only, and not for ‘general’ education audiences, this was not without its own issues.
The title, description and educational value statements – all provided by the museums – did occasionally include inaccurate or inappropriate expressions or information. The education context in particular, which was often sourced from the museum’s statement of significance, historical notes or equivalent, consistently required reworking by TLF educators. These educators completed fact checking; ensured a consistent language within and between digital resources; and edited descriptions and educational value statements to suit the audience. Teachers generally appeared to assume that the background material provided with the items would be accurate, given their source.
Although it was considered very valuable for the metadata to be drawn directly from the museums, and it was deemed the responsibility of the cultural organisation to ensure accuracy and relevance, it was also valuable to maintain TLF QA process as an ‘extra set of eyes’ focused on the specific needs of end users.
(The Learning Federation, 2009, 74)
The pilot revealed marginal use of collection resources:
Of the 643 digital resources provided to schools as part of the new model of collaboration between TLF and the three museums, 55 digital resources were selected by schools to include in collaborative learning activities. Of this number, six resources were used more than once.
(The Learning Federation, 2009, 40)
On the upside, the few things that the sampled teachers did use, they agreed were of sufficient quality and authority to be useful. (The Learning Federation, 2009, pp41-43)
This shouldn't bring too much comfort - as despite their value, even the self-described technically savvy teachers targeted in the pilot were unaware of the existence of such resources. This indicates a failure of traditional offline marketing and promotion to teachers.
Segmenting educational users
As I've argued previously, museums need to think deeply about measuring and learning from how visitors use their on-line content (Chan, 2008) - and basic Web analytics is a good place to start to look at the use of our collection.
The period of analysis of the Powerhouse spreadable collection project was 25 weeks, from mid-July 2009 to mid-January 2010. This period encompasses two school holiday periods but also coincides with peak visitation periods for the Powerhouse Museum - the Sydney Design Festival and Ultimo Science Festival in August, and the summer holiday exhibition period of December and early January.
Use data was gathered using Google Analytics with Javascript page tagging and excludes all internal traffic - including traffic from visitor devices connected to the Museum's network and collection kiosks in exhibition galleries. This has prevented any internal staff use of the collection database being reported in the data.
Data has been further segmented to identify all traffic, all Australian traffic, and all traffic originating from NSW Department of Education (NSW DET) IP pools using the Network Location/Service Provider data from Google. State-based data has been aggregated using the Google Analytics Dimensionator addon.

Chart 1: State breakdown of Australian Web traffic
Australian traffic represented 41.85% of traffic to the Museum’s Web site. Unsurprisingly this Australian traffic is heavily skewed towards NSW (and with further drilldown, to Sydney). This reflects the geographic awareness of the Museum as well as the capacity of local Web site visitors to convert to through-the-door visitors. Traffic from states other than NSW (which is represented in proportion to population size) is collection oriented.
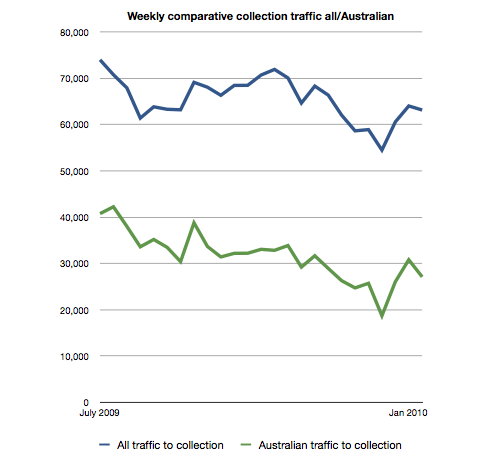
Chart 2: Weekly comparative collection traffic
Examining the collection traffic in more detail shows that Australian use of the collection represents 31.30% of overall collection traffic. The USA represents 26.21% and the UK, 13.95%. Seasonal trends - especially the lower volume of Internet traffic over the December holiday period - are clearly visible.
| Description | URL ID | Views |
|---|---|---|
| Framed gold mining license, 1853 | /?irn=8512 | 3708 |
| Chocolate box evening dress, Jenny Bannister, 1979-1981 | /?irn=138570 | 1982 |
| Gold washing cradle used in the Ophir goldfields, 1851 | /?irn=253784 | 1910 |
| Packet of Bex powders, 1965-1975 | /?irn=340661 | 1864 |
| Mantel clock, Session Clock Co, USA,1905-1915 | /?irn=127437 | 1754 |
| Mantel clock, Waterbury Clock Company, USA, c1890 | /?irn=51710 | 1675 |
| Catalina Flying Boat Frigate Bird II, 1944 | /?irn=207900 | 1623 |
| Berger Paints Colour Chart, 1959-1960 | /?irn=128073 | 1435 |
| Ship model, HMS Sirius, 1937 - 1938 | /?irn=238337 | 1301 |
| Steam locomotive No. 3830, 1949 | /?irn=85075 | 1271 |
Table 1: Top ten collection objects for period - global traffic
| Description | URL ID | Views |
|---|---|---|
| Framed gold mining license, 1853 | /?irn=8512 | 3528 |
| Gold washing cradle used in the Ophir goldfields, 1851 | /?irn=253784 | 1833 |
| Packet of Bex powders, 1965-1975 | /?irn=340661 | 1650 |
| Steam locomotive No. 3830, 1949 | /?irn=85075 | 878 |
| Ship model, HMS Sirius, 1937 - 1938 | /?irn=238337 | 871 |
| Stove, fuel, cast iron, Metters, Australia, 1900-1939 | /?irn=94766 | 865 |
| Catalina Flying Boat Frigate Bird II, 1944 | /?irn=207900 | 794 |
| Rabbit trap made by Henry Lane Ltd, 1935 - 1960 | /?irn=362289 | 727 |
| Blue Holden by Margaret Dodd | /?irn=75875 | 711 |
| Chocolate box evening dress, Jenny Bannister, 1979-1981 | /?irn=138570 | 689 |
Table 2: Top ten collection objects for period - Australian traffic
Both global and Australian traffic exhibit a long tail of interests. Australian traffic is weighted exclusively towards object records with Australian relevance, although there are exceptions. For example, the Chocolate box evening dress (IRN 138570) is in the top ten in both lists but receives a proportionally greater volume of global traffic despite being designed by a Melbourne designer. However, 95% of the traffic to the Framed gold mining license (IRN 8512) and Gold washing cradle (IRN 253784) is Australian.

Chart 3: Weekly NSW Department of Education and Training (DET) collection traffic
NSW DET traffic is highly seasonal, with almost zero traffic being recorded during school holidays.
| Description | URL ID | Views |
|---|---|---|
| Framed gold mining license, 1853 | /?irn=8512 | 423 |
| Gold washing cradle used in the Ophir goldfields, 1851 | /?irn=253784 | 270 |
| Gold License, issued to J Thomas, paper, Loddon West Goldfields, Victoria, 1852 | /?irn=9954 | 112 |
| Model of the Welcome Nugget discovered in Victoria in 1858, 1885 | /?irn=124 | 92 |
| Ship model, HMS Sirius, 1937 - 1938 | /?irn=238337 | 85 |
| Blue Holden by Margaret Dodd | /?irn=75875 | 62 |
| Spacecraft, replica, Lunokhod-2,USSR/Russian Academy of Sciences, 1957-1984 | /?irn=157004 | 62 |
| Opera costume worn by Dame Nellie Melba, 1905 - 1915 | /?irn=163391 | 52 |
| Satellite, replica, Sputnik-1, USSR/Russian Academy of Sciences, 1957-1984 | /?irn=156934 | 52 |
| Spacecraft, model, Luna-9, USSR/Russian Academy of Sciences, 1957-1984 | /?irn=157003 | 48 |
Table 3: Top ten collection objects for period - NSW Department of Education traffic
NSW DET collection traffic shows an unsurprising bias towards clearly identified curriculum-oriented objects in the collection - gold mining, Australian history and space transport.
Disappointingly, although the Museum has made considerable efforts to align itself with the Design & Technology curriculum, the design collection is very under-represented. Instead, traffic for subjects in the Design & Technology area tends to go to two bespoke resources (Designers at Work and Australia Innovates) on the Museum Web site. On one hand, this is positive – students who do use the Powerhouse Web site are using resources made specifically for them. On the other hand, it is problematic because the Powerhouse (as is the case for most other institutions) is not in the position to be able to customise all content for specific audiences in these ways.

Chart 4: Use of different on-line Powerhouse resources by NSW DET visitors
At-school use of search for site discovery
At school, visitors using the NSW DET proxy reach the Powerhouse Museum Web site in a number of different ways: 66.37% use search, 23.24% come directly from the URL or a local browser bookmark, and 9.50% come via referring sites. These referring sites are largely made up of the NSW DET Teacher and Learning Exchange portal (TALE) and school-based learning management systems (Moodle, etc.)
In contrast, 91.75% of NSW DET visitors who use the collection on the same Web site enter via search. This subgroup of visitors (11.23% of the total NSW DET visitors) arrive on 1438 different landing pages, 1397 of which are within the collection database.
A very long tail of 1,944 search terms are used, with around 6% containing 81 variants of 'powerhouse museum' either on its own or with other keywords attached. This indicates that NSW DET visitors are using tightly constrained terms to intentionally reach the Powerhouse Museum, and a long tail of minor terms in a less focused way. They are highly collection oriented visitors, and different in behaviour from those from DET who visit other parts of the site (and visit very little else). They are coming for specific information - 133 search terms contain variants of 'gold', likely as a result of being set particular tasks.
Out-of-school use
Currently, museum content is likely to be of most value to school students outside of school time - as a resource for homework exercises and research. Because this traffic comes in through private Internet service providers (ISPs), it cannot be easily segmented out.
To attempt to determine what percentage of 'educational traffic' to the museum Web site is 'out of school' or from non-government schools in NSW, I have taken the two most popular educational resources - Designers at Work and Australia Innovates - and segmented their traffic to distinguish what percentage of their NSW traffic is from NSW Department of Education - the rest being either for private home use or from non-Government schools. Using the NSW DET schools segment, as we have seen earlier, these two sites represent nearly 60% of the traffic to the Powerhouse from within NSW government schools.
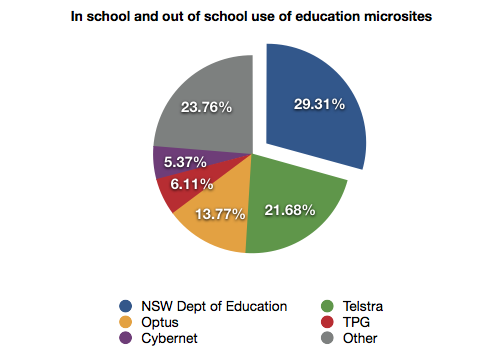
Chart 5: In-school and out-of-school use of Powerhouse Museum education microsites
Here we see that 70.69% of traffic to these two very popular microsites combined occurs outside of Government schools. (The 'other' category in the graph contains a long tail of 235 Internet service providers - from mobile and small ISPs, private companies, and marginal use by independent schools and universities.)
Introducing Content Tracking
Tynt (www.tynt.com) is one of several 'content tracking' services. Developed initially to stop piracy, content tracking has now broadened its purpose as some commercial content publishers have realised the importance of spreadability to brand awareness and findability. Tynt operates in the same space as Attributor (www.attributor.com), Copyscape (www.copyscape.com) and image tracker Tin Eye (www.tineye.com). Associated Press (AP) uses Attributor to track news content syndicated around the world. Attributor promotes its service on its Web site:
Today’s Web is a cut and paste playground in which your articles move freely from site to site without regard for the original publisher. Unauthorized content reuse is growing over 15% a year and top newspaper and magazines are finding dozens of unauthorized copies for every article produced. These unauthorized copies siphon away your valuable audience and millions of dollars of licensing and advertising revenue per year.
(Attributor, 2010)
Another notable tracking service which operates in the entertainment sector is Big Champagne (www.bigchampagne.com). Big Champagne tracks consumer interactions with media content, both traditional and untraditional – such as flow of BitTorrent data across the Internet - and provides 'charts' for subscribing companies. This model has been interesting for its non-enforcement role and the valuable intention data and ‘buzz measurement’ it gathers for content creators and distributors. This data, such as which particular single MP3s of an album is being most shared, or which movies are being spread using Torrents, is very valuable for content creators and publishers in understanding and tracking audience demand. Even if they do not intend to meet such demand, this behaviour tracking is valuable as market and consumer research.
With the Big Champagne model rather than the punitive Attributor model in mind, in July 2009 the Powerhouse Museum started experimenting with Tynt.
Tynt explains:
Tynt Insight anonymously detects when content is copied from your site, and can help determine what they are doing with it. At Tynt we believe content copying can be beneficial to the site owner. We find that most people copy content innocently because they are your fans. They copy content to either preserve it for themselves or to share it. Half of copied content is still shared by email because it is still the easiest and most familiar way to share content.
(Tynt, 2010)
A small Javascript tracking code was added to the footer of each object page. When modern browsers select and cut content from a tagged page to add to the operating system Clipboard, Javascript intercepts this browser activity and does two things. First, it logs the request with Tynt, and second, it appends a small piece of customisable text to the Clipboard copy which includes the source URL and an identifier code. When the content is then pasted from the Clipboard, it contains the customised code.
For example, here is a piece of text copied with Tynt.
Jenny Bannister designed her first plastic dress in 1977 when she was invited to a 1950s party and wanted something different to wear. Clarence Chai asked her to design more for his shop. She designed a range for fashion expo, each with a different theme.
Read more: http://www.powerhousemuseum.com/collection/database/?irn=138570#ixzz0dUICMCcQ
Under Creative Commons License: Attribution Non-Commercial
The appended content clearly identifies the license under which the copied content is made available, and the 'Read more' URL acts as a ‘welcome mat’ for readers to explore further. This URL allows the tracking of 'referrers' sent by particular uses of the copied content if it is placed on another Web site. As Tynt does not collect IP data, it remains compliant with the Powerhouse’s privacy policy.
For school students, it is expected that one common mode of interaction with the Museum's collection will be through cut & paste of content into assignments. If this is the case, then cut & paste data will be a useful measure of 'appropriateness' as a piece of content that is frequently cut & pasted would imply a direct usefulness that is harder to determine for material that is 'just read' (page view). An analogy would be the contrasting of circulation data in an academic library (the equivalent of page views) compared with citation figures (usefulness).
The results
During a six-month period, 20,749 copies were made: 5% of these copies were images – predominantly thumbnails and, curiously, the Museum's corporate logo; 36% (7,601) were copies of 7 words or less in length. Tynt calls these 'search copies' and implies that their likely use was for use in search. These search copies do not have licence and linkback text appended to them. The remaining 58% (12,608) were copies of greater than 7 words and thus had license and linkback details added to them. These 12,608 copies contained nearly 3 million copied words (2,906,330 words).
Comparing basic page view data between Tnyt and Google Analytics revealed only minor differences in figures. These fall within an acceptable margin of error and are likely to be attributable to two key differences in tracking methodologies. First, Tynt does not allow the exclusion of views internal to the Powerhouse. Second, the Tynt Javascript is likely to not be as cross-browser compatible as the Google tracker.
What Objects Are Popular for Cutting & Pasting?
| Description | URL ID | Copies Made | Words Copied | % views making copies | % Australian traffic | % NSW DET traffic |
|---|---|---|---|---|---|---|
| Framed gold mining license, 1853 | /?irn=8512 | 297 | 45,748 | 8.63% | 95.14% | 11.41% |
| Gold washing cradle used in the Ophir goldfields, 1851 | /?irn=253784 | 236 | 39,098 | 13.04% | 92.58% | 13.89% |
| Packet of Bex powders, 1965-1975 | /?irn=340661 | 196 | 8,798 | 11.56% | 86.39% | 0.99% |
| Argyle chair by Charles Rennie Mackintosh, 1898 - 1899 | /?irn=168257 | 103 | 11,092 | 26.69% | 10.93% | 0.00% |
| Juicy Salif' lemon squeezer by Philippe Starck for Alessi | /?irn=9354 | 95 | 11,366 | 22.41% | 11.68% | 0.00% |
| Wiggle' chair by Frank Gehry, 1969 - 1972 | /?irn=12217 | 92 | 14,107 | 18.93% | 33.54% | 0.00% |
| Blue Holden by Margaret Dodd | /?irn=75875 | 81 | 6,060 | 9.44% | 83.16% | 7.49% |
| Long Chair' by Marcel Breuer, 1935 - 1936 | /?irn=167934 | 76 | 7,556 | 18.63% | 22.59% | 0.00% |
| Carlton' Room Divider, designed by Ettore Sottsass, made by Memphis, Italy, 1981 | /?irn=54096 | 66 | 3,894 | 14.96% | 55.69% | 0.00% |
| San Hsien, Chinese string instrument, China, c. 1880 | /?irn=19343 | 57 | 5,093 | 21.27% | 7.81% | 0.00% |
Table 4: Cut & paste use of Powerhouse Museum collection objects
In contrast to previous tables showing collection records ordered by the number of views, this table shows a different picture of objects ordered by the number of copies. It also shows the number of copies they have generated, as well as the percentage of views resulting in copying.
Column six shows the percentage of traffic to that object record coming from Australia gathered via Google Analytics. Of the top ten ‘most copied’, only five have more than 50% Australian traffic, and only three have any significant traffic from within the NSW DET segment.
Let's take a look at some objects in greater detail to see what is being copied, as well as where those copies are ending up.
Framed gold mining license, 1853
This is the most viewed object when measured both by Google and by Tynt. Using the Google data, we can see that 95.14% of the traffic visiting this object is Australian, 11.41% from NSW DET addresses. There is a strong case that the majority of traffic to this object is from Australian school students and drilling down into the Australian data in Google Analytics we can see that it is mainly NSW (58.76%) and Victorian (25.14%) traffic:
78% of copies (233) were of text greater than 7 words in length, 15% of 7 words or less, and 7% images. Using Tynt's basic heatmapping tool, it is possible to see the popular sections of the document that were copied. In total, Tynt has counted 45,748 words copied from this object record in the time period – primarily from the 308-word-long Statement of Significance and 102 words from the object’s History Notes.

Fig1: Heat map of gold mining license collection record
However, this object also appears in three other Web sites operated by the Powerhouse. Whilst these have not been tracked with Tynt, we can still look at the traffic that they collect for comparison. D'Hub (formerly Design Hub) presents the same object record in full and received 33 views for the same period. About NSW shows only the Statement of Significance and received 30 views. The third, the NSW Migration Heritage Centre has taken the object record and image and broadened its context whilst retaining about 50% of the original record verbatim. This record was viewed 2,794 times, 9% of which was from the NSW DET segment. Both About NSW and NSW Migration Heritage Centre versions contain linkbacks to the original Powerhouse record. The extraordinary volume of views on the Migration Heritage Centre Web site proportional to its overall Web site traffic is a result of heavy packaging for education use and effective marketing of a small group of resources.
What Gets 'Cut and Pasted'?
The heat maps for these popular objects generally show the value of a statement of significance for an object. The Collections Council of Australia updated the definition of 'significance' in Significance 2.0:
A statement of significance is a reasoned, readable summary of the values, meaning and importance of an item or collection. It is more than a description of what the item or collection looks like. A statement of significance summarises how and why the item or collection is important. It is supported by research and evidence assembled through the assessment process.
The statement of significance incorporates all of the elements that contribute to the meaning of items and collections including appearance, fabric, design, context, environment, history, provenance, uses, function, social values and intangible associations.
Drawing all these values and attributes together into a statement of significance is an effective way of communicating and sharing knowledge about why an item or collection is important, and why it has a place in a public collection. (Collections Council of Australia, 2009)
Where these statements exist, they are the most copied sections of text - confirming that they are useful and 'audience-focused'. However, where these do not exist, the basic object 'description' is popular. The three objects that share significant Australian and NSW DET audiences - the Gold Mining License, the Gold-washing Cradle and Margaret Dodd's Blue Holden - show much the same behaviour as other objects that have been cut & pasted.

Fig 2: Heat map of gold washing cradle collection record

Fig 3: Heat map of ‘Blue Holden’ by Margaret Dodd collection record”
Where does 'cut and pasted' content end up?
The vast majority of content that is cut & pasted does not end up on the Web (or has its tracking codes stripped). This is not unexpected as most users will paste content into e-mails or, in the case of students and researchers, into static text documents.
Tynt relies on click tracking (in contrast to other services such as Copyscape that use deep Web trawling) to discover the destination. It is not surprising that much of the copied content is not 'clicked through' - if it doesn’t get cut and pasted into a Web site, then it can’t be tracked.
However, that which has generated click throughs has ended up in some unexpected places. Quite a few separate eBay auctions and a Craigslist want-item used words (and retained the tracking code) from Museum object records - a chemist's sign (since removed by eBay), a vintage camera, some Grant Featherstone chairs, a meat safe from a farm, a teaspoon, a Sesame Street Muppet doll, a Japanese toy car, and some plastic brick toys akin to Lego. A seller on the Argentinian equivalent to eBay, MercadoLibre, used an entire collection record on their auction of a 1970s TV set. (http://articulo.mercadolibre.com.ar/MLA-60222451-televisor-jvc-videosphere-ano-70-japones-totalmente-redondo-_JM). The use of the Museum’s descriptions in auctions is likely a means of ‘validating’ their significance to prospective buyers and thus, the seller hopes, increasing the sale price.
Other tracked copies ended up in blogs and forums - including some like this clog enthusiast who has a go at the dry formal tone of the Museum's descriptions:
But that's "museumspeak" for you. All those clinical observations are well and good, but it doesn't take a rocket scientist to see that these shoes are FABULOUS! (http://everycloghasitsday.typepad.com/every-clog-has-its-day/2009/10/remembrance-of-clogs-past.html).
The Hall-Scott A-7-A Aero Engine (/?irn=76898) is a less popular object, but one that has generated a high views to linkbacks ratio (26.85%). This object has had 475 words of text cut & pasted - some of them into Wikipedia into an article where the tracking link has stayed in place. This link has generated 78 views back to the source record of 285 total views for the period, with 12.72% of the traffic being Australian (57.23% USA). This demonstrates both the value of content being used in Wikipedia as well as the value of tracking such content copying.
Mashups
During the research period, the Powerhouse also made the entirety of its collection metadata available for download. Approximately 10% of the 1,966 visitors to the collection download page (/collection/database/download.php) downloaded a version of the collection data.
Largely driven by well promoted Australian mashup contests and developer events, these downloads have resulted in four known mashups being created using the dataset – all currently part of the Mashup Australia contest. The most-well-devloped of these was Flip Explorer (http://mashupaustralia.org/mashups/flip-explorer/) which was highly commended in the contest. Flip Explorer is a kiosk-style collection browser.
Further mashups may emerge through the NSW State Government’s Apps4NSW contest which closes in February 2010. The data was also made available on request to the Science Museum’s (London) Cosmic Collections project.
Limitations
The raw data in this study is not without significant limitations.
Tynt data is unable to be easily date segmented at this stage. The current Tynt Public Beta package offers only a 7-day or 30-day rolling view of data or an 'all data' view. Further, the inability to segment by geography prevents definitive correlation between user types - and certainly not to the level that Google Analytics allows.
The re-use tracking that Tynt offers is limited in the context of museums because of the predominantly off-line value of museum content - the primary destination and use being in written essays and research papers. Museum collection content is unlikely to be replicated on-line manually via cut and paste - although for the Powerhouse there is obvious reuse occurring on auction sites and in casual contexts.
Similarly, the Google Analytics data has a number of caveats. Not all browsers will have executed the tracking script, and some may have blocked the cookies that Google sets. Because the data used does not draw on measures of 'uniqueness' (unique visits, unique page views), these issues have been minimized, but they need to be kept in mind if replicating this experiment.
The service provider data that has allowed the segmentation of the NSW DET traffic from other traffic is based upon Google Analytics' IP aggregation technologies. It may exclude some NSW DET computers, and it is unable to be determined whether this traffic includes the NSW DET Digital Education Revolution laptops. These Government-supplied free laptops are currently being distributed to senior high school students across the state and are currently blocked from accessing the Powerhouse Museum Web site. Fortunately, these have only just begun to roll out, and thus have only marginal impact on the use data thus far. As these free laptops continue to use a filtered Internet connection even in a home-use situation, the Powerhouse is working to have this arbitrary site blocking removed. A look inside the referring sites shows a significant number of individual school intranets, indicating that the service provider data from Google is effectively picking up internal school computers.
Recommendations and Conclusion
This study reaffirms the belief that collection data is valuable to a broad population of users. Yet without significant promotional efforts into the education sector, they will remain underused by this key user group. It is highly likely that the success of expensive ‘showcase sites’ that are the most common type of museum Web content made specifically for education users is due to their marketing budgets - something which collection databases rarely have.
Traditionally, significant (and costly) awareness campaigns have been reserved for current or imminent exhibitions and programs. The on-line collection re-use data from the Powerhouse suggests that an increase in use and re-use by students of on-line collection information will only be achieved if the Museum runs a significant awareness campaign around topic areas in its collection database that are of particular relevance to the education sector.
Moving now to the methodology, the study shows that the combined approach of standard Web site analytics with a content tracking service such as Tynt provides a new set of audience insights. Whilst this is still in an early stage, it is possible to see considerable differences in user behaviour across the Powerhouse collection, and it has identified some specific patterns of user interest which now need to be addressed and served. Like all quantitative research, this data needs to be accompanied by complementary qualitative studies.
Already the study has revealed a small group of NSW schools which are active users of the Museum’s collection database, and now qualitative work can be undertaken to determine how this group of users mine the collection data, and whether they find it meets their teaching needs. The sheer volume of content manually cut & pasted from the collection documentation over the research period is phenomenal. To a degree, this validates the Powerhouse’s move to making collection documentation usable by third parties by explicitly licensing the textual documentation under a liberal Creative Commons license – especially in the unique Australian statutory licensing environment where this cut & paste usage would trigger statutory licensing liabilities in a school.
It is too early to be able to explore the effectiveness of making collection data available to the general public using programmatic means (APIs). Whilst APIs clearly serve a valuable purpose in connecting up collections within the library, archive and museum (LAM) sector, the value of this outside of the sector is still uncertain. Again, it would seem that very traditional promotional strategies need to be employed to interest non-LAM developers in cultural data and excite them about the potential opportunities.
For all in the cultural sector, the pressure to achieve more with less intensifies. Staff are expected to do all they have done in the past as well as stay abreast of technological and museological changes and potential, and actively participate in the ever-changing social media space. For most of us, it is not possible to work harder - so we need to work smarter. Similarly, the funding we have to work with seems ever-diminishing.
In the event that resources are not diverted to developing or promoting on-line collections, then at least we now have tools to begin to measure the use and re-use of the records we have - so that we can direct the resources we have to what is useful for schools.
Those considering diverting resources from expensive and short-term ‘showcase sites’ towards improving their raw collection data for the education sector need to consider the following:
- Does opening up raw collection content make it more attractive and useful to education audiences?
- Are educational users sophisticated enough to make use of this raw content effectively?
- If they are not, then how can museums help increase the digital literacy of the education sector to make the most of this content?
Acknowledgements
The author would like to thank Irma Havlicek and Ingrid Mason for their robust advice on the paper, and acknowledge the ongoing collegial support of the Digital teams at the Powerhouse Museum.
References
Attributor, 2010, http://www.attributor.com/solutions/text_monitor.php, accessed 18/1/2010.
Bayne, S., J. Ross & Z. Williamson (2009). National Museums Online Learning Project final report. V&A/University of Edinburgh. Available at http://www.education.ed.ac.uk/dice/nmolp/pdfs/finalreport.pdf
Browne, D. (2009). “Educational use and the Internet – does Australian copyright law work in the web environment?” Presented at Unlocking IP Conference 2009: National and Global Dimensions of the Public Domain. University of NSW, April 2009. Available at http://www.cyberlawcentre.org/unlocking-ip/2009/materials/Papers/3B_DBrowne.pdf
Chan, S. (2008). “Towards New Metrics Of Success For On-line Museum Projects”. In J. Trant and D. Bearman (eds). Museums and the Web 2008: Proceedings. Toronto: Archives & Museum Informatics. Published March 31, 2008. Consulted January 28, 2010. http://www.archimuse.com/mw2008/papers/chan/chan.html
Chan, S. (2007). “Tagging and Searching – Serendipity and Museum Collection Databases”. In J. Trant and D. Bearman (eds). Museums and the Web 2007: Proceedings. Toronto: Archives & Museum Informatics, published March 31, 2007. Available at http://www.archimuse.com/mw2007/papers/chan/chan.html
Finnis, J. (2008). "Turning cultural websites inside out: changes in online user behaviour, Web 2.0 and the issues for the culture sector". In Digital Culture: the changing dynamics (eds Uzelac, A. and B. Cvjetièanin ). Institue for International Relations, Zagreb. Available at http://www.culturelink.org/publics/joint/digicult/digital_culture-en.pdf
Finnis, J. (2009). “Online Technology: Unlocking opportunity, unlocking collections”. In Learning to Live: Museums, young people and education, eds Bellamy, K. and C. Oppenheim. Institute for Public Policy Research and National Museum Directors' Conference 2009, UK. Available at http://www.nationalmuseums.org.uk/media/documents/publications/learning_to_live.pdf
Jenkins, H. (2009). "If it doesn't spread its dead", published February 11, 2009, http://www.henryjenkins.org/2009/02/if_it_doesnt_spread_its_dead_p.html.
Peacock, D., S. Tait & C. Timpson (2009). “Building Digital Distribution Systems For School-Based Users Of Museum Content: New initiatives in Australia and Canada”. In J. Trant and D. Bearman (eds). Museums and the Web 2009: Proceedings. Toronto: Archives & Museum Informatics. Published March 31, 2009. Available at http://www.archimuse.com/mw2009/papers/peacock/peacock.html
Russell, R. & K. Winkworth (2009). Significance 2.0: a guide to assessing the significance of collections, Collections Council of Australia. Available at http://significance.collectionscouncil.com.au.
Royston, C. “A Guide to Managing a Large Multi-Institutional Project in the Cultural Sector”. In J. Trant and D. Bearman (eds). Museums and the Web 2009: Proceedings. Toronto: Archives & Museum Informatics. Published March 31, 2009. Available at http://www.archimuse.com/mw2009/papers/royston/royston.html
Shirky, C. (2009). "Let a thousand flowers bloom to replace newspapers; don’t build a paywall around a public good". September 23, 2009, http://www.niemanlab.org/2009/09/clay-shirky-let-a-thousand-flowers-bloom-to-replace-newspapers-dont-build-a-paywall-around-a-public-good/
Tynt (2010). http://www1.tynt.com/why-tynt-insight, accessed 18/1/2010
Springer, M., B. Dulabahn, P. Michel, B. Natanson, D. Reser, D. Woodward & H. Zinkham (2008). “For the Common Good: The Library of Congress Flickr Pilot Project”. US Library of Congress. Available at http://www.loc.gov/rr/print/flickr_report_final.pdf