
![]()
![]()
![]()
![]()
![]()
![]()
![]()
![]()
![]()
![]()
![]()
When is the next
Museums and the Web?
![]()
Archives &
Museum Informatics
158 Lee Avenue
Toronto, Ontario
M4E 2P3 Canada
info@ archimuse.com
www.archimuse.com
| |
Search
A&MI |
Join
our Mailing List.
Privacy.
Copyright
Archives & Museum Informatics
2000

Bringing the object to the viewer: Multimedia techniques for the scientific study of art
Michael Douma, Institute for Dynamic Educational Advancement and Michael Henchman, Brandeis University, USA
Abstract
Often, topics can be taught online that are unteachable in other media. One such topic is materials science and art -- an increasingly popular topic for art museum visitors. This is a visual subject, which requires visual materials for teaching and learning. Books, articles, slides, videos are often unavailable, inaccessible or in an unuseable form, and the physical nature of museum objects generally precludes side-by-side comparisons.
To identify the underdrawing of a painting, one must be able to superimpose infrared and normal photographs of the painting. To authenticate a particular Greek kouros, one has to be able to view it from all angles for comparison with authentic kouroi. Pictures in books, and discreet kouroi in different museums will not accomplish that. The material must be made available in a useful form.
We are now completing a 1 1/2 year project (an NSF sponsored partnership between Brandeis and the National Gallery of Art), for an interactive web site about Bellini's Feast of the Gods. This exhibit should be online in late January.
Our exhibit, Investigating Bellini's Feast of the Gods, considers a single painting. Within the period 1514-29, it was painted and overpainted three times. Scientific data are presented, enabling the viewer to reconstruct interactively the various versions and reasons for the overpaintings. The viewer discovers the chemistry of the pigments and their degradation, how the scientific investigation was performed and how to identify the various painters. Uniquely the exhibit allows the viewer to manipulate imagesómagnifying, superimposing, and comparing. The painting is examined in great detail.
Our paper will address the specific technologies and pedagogical approaches which we have used that may have direct application to other art-and-science web sites. For example, a common challenge is to make one exhibit that is useful to many different audiences. It is important not to lower the common denominator too low, or the exhibit will be useless for all. This is easier to accomplish in an online exhibit than in a physical one because whole sections on a site can be geared toward more knowledgeable visitors without disrupting the experience for others. Another approach -- which has been very successful for us -- has been to limit the scope of our subject matter. By focussing on depth rather than breadth, often experts and non-experts alike are able to wholly follow a narrow topic without being overwhelmed with too many academic concepts. We are thus able to keep the level of sophistication quite high.
Increasingly, new scientific techniques are being applied to the scientific study of art. These deliver an embarras de richesse but the data are only useful if they are accessible to the individual evaluator. How can one interpret an X-radiograph of a painting unless one can compare the two images directly, in a situation where both magnification and contrast can be varied? The availability of digital images and their ready transmission over the Internet has provided an exciting solution to this problem. Today, with convenient access to the primary data, each one of us can render individual judgements on the pressing issues of the moment. No longer are we limited by the printed page and by the information fed to us by the cognoscenti. Instead, we are open to the widest possible range of input from a complete spectrum of attitudes and vantage points.
This new horizon is revolutionizing teaching and learning. Hitherto, the medium of instruction in this visual field has been the slide. The slide is the degraded image of another degraded image ó a figure in a book. Comparing a painting with its X-radiograph was then a comparison between two doubly degraded images. It is difficult to evaluate what can be accomplished thereby. Worse, the comparison is often only a fleeting instant in a lecture, incapable of being recalled by the audience. Comparison of singly degraded image within in a book, is subject to a different limitation. One will be on one page; and the other, in general, will be on another.
We were brought face to face with this impasse when teaching a course on the scientific aspects of art to students of Fine Arts (art historians and studio artists) at Brandeis University. We were delighted to be able to use, as a central case study for the course, the remarkable restoration and investigation of the painting, dating from 1529, The Feast of the Gods from the National Gallery of Art in Washington, D.C. For fifty years it had been known that this sensational painting held beneath its surface evidence of an unusual complexity. But it was only in the late eighties that investigative techniques became sufficiently developed that the interior of the painting could be explored. The ultimate success of the project, which took five years, was due to the extraordinary skill of the two people responsible ó David Bull, head of restoration at the NGA, and the late Joyce Plesters, head of conservation science at the National Gallery, London. Based on three types of physical evidence ó an X-radiograph, an infrared reflectograph and 22 paint cross sections ó they were able to establish that The Feast of the Gods had not one paint layer but three. They were then able to map the two underlying layers, thereby revealing how the painting would have appeared in 1514 and 1522 according to the two artists responsible, Giovanni Bellini and Dosso Dossi, respectively.
This fascinating "archaeological dig" has been documented extensively in a monograph published by the NGA and in a delightful film made by the award-winning director David Sutherland. While this ó the account, the interpretation and the background ó could not have been of higher quality, it did not and could not provide us with the evidence we needed to make the complete scientific case. We needed to be able to superimpose the X-radiograph, the infrared reflectograph and a detailed image of the picture. Whereas Bull and Plesters had had continuing microscopic access to the picture, we did not. We therefore required images which were almost as well defined as the picture itself.
We not only needed the scientific data in great detail, we needed it in a form for students to be able to use for their own interpretations. Their need is to be able to manipulate the data at will, to use the data first to formulate hypotheses and then again subsequently to validate or invalidate them. We realized that Bull and Plestersí data were only of use to us if it could be manipulated Ö and we were astonishingly fortunate that David Bull supplied us with raw data which we could then digitize.
In presenting the data in a form suitable for students to interpret, the challenge has been, on the one hand, not to direct that interpretation while, on the other, providing enough background ó about the painting, the period, the structure of paintings, the technique of painting and the scientific methods of investigation. More discussion of this is given below. We were particularly concerned, as scientists, to school our artist students in the types of (scientific) statements which the data would allow us and in the types which the data would not.
Finally there was the question of the form in which the digital data should be transmitted to our students and to other teachers of other students. Three years ago, we were convinced that the proper medium was the CD-ROM. We did not anticipate instant wealth but projected an income sufficient to cover costs. At that time there were still publishers marketing CD-ROMís of appropriate quality but in the subsequent three years, that situation has changed. Moreover we now realize that we could have never even recovered the necessary image licensing costs. It is now therefore available at no cost on the internet <http://www.webexhibits.org/feast>.
Specific techniques
We have successfully utilized a number of techniques for visualization that have direct application to many types of projects. These techniques use well established internet multimedia techniques and should be accessible to the vast majority of web visitors:
1. The spyglass
Issue: How can visitors compare multiple versions of the same image?
In the physical world: In an actual museum or laboratory, your visitors might lay the images side by side. They could then compare the images as a whole. They also might view the images in detail through a loupe, switching back and forth between comparable features in each image.
On the internet: Images can be overlaid in layers, and visitors can switch what layer they are viewing. Additionally, we can put a "hole" in an image, revealing the image layer beneath it. This creates an effect like a searchlight, or spyglass being moved around the image, allowing details of each version to be directly compared.
Technical details: Using Macromedia Shockwave. 1) Prepare images in an image editor (such as Photoshop), to be exactly the same dimensions. You may need to rotate, resize, and skew your images. To maximize sharpness, you should stretch oversize images, then downsample to final size when you are through transforming them. 2) Using Shockwave, create a one bit mask for each image, apply mask ink. 3) While the mousedown, adjust the spyglass sprite loc, and move the mask regpoint the opposite direction. 4) Export shockwave movie, with images dynamically imported.
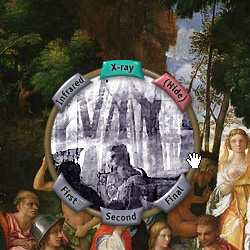
Figure 1. We see evidence for a forested background in the X-ray image of Belliniís Feast of the Gods.
2. The zoom view.
Issue: How can you look at an image in great detail?
In the physical word: A viewer will look very closely, or use a magnifying glass.
On the internet: Small portions of the image can be viewed in detail. The visitors can adjust their view vertically and horizontally, zoom in and out, or click on a thumbnail image to re-center their view. Often the visitor can see the image in greater detail than they could in a museum, where they might not be able to reach all portions of the image, for example, it is hard to see the top of a large painting in detail.
Technical details: Using server scripts or JavaScript. 1) Divide image into hundreds of rectangles using Adobe ImageReady to define equally spaced guides, and define slices based on guides. Choose, perhaps, a 10x10 or 30x30 matrix. 2) Display the rectangles within an html table. 3) You may either generate the page or frame via a server-side script, or dynamically change the image.src with JavaScript. Use modular arithmetic to calculate the frame numbers. 4) Re-center the image using a simple input image.
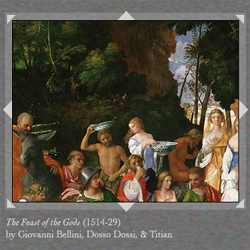
Figure 2. Detail of the Feast of the Gods is viewed in considerable detail.
3. The floating descriptions
Issue: How can you describe the many details of an image?
In the physical word: In a museum, a curator can give a tour, pointing to different portions of a painting, and describing different aspects, such as artistic style, or the painting technique. In a book, sometimes numbers are overlaid on an image, with descriptions to be found in a table next to the image. The reader correlates the number with the description.
On the internet: The image can be divided into dozens or hundreds of invisible regions. When the visitor points their cursor at a region, a description is displayed next to the cursor. Thus, a mass of data is navigated. The visitor only sees the image and one description at a time.
Technical details: Using Macromedia Shockwave. 1) Create a false color version of the image with regions of flat color overlaying the image. Anti-aliasing off 2) Reduce the image size be at least 1:4 in each dimension. Nearest neighbor sampling. 3) Export the image as raw format. 4) Place the raw file on the internet. 5) Load the image as a text file with Shockwave, getNetText, into a global variable. 6) During mouseover, calculate the mouse position, relative to the sprite image. Calculate corresponding pixel number, counting row by row. Divide by 16 (1:4 x 1:4). 7) Determine integer value of corresponding character in the text file. 8) Correspond the character to a table of descriptions, using a case statement. 9) Place the description into a text member, and position the sprite next to the cursor.
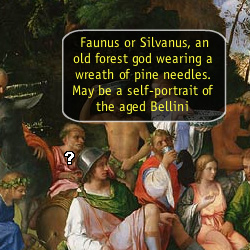
Figure 3. We learn Silvanus might be a self-portrait of Bellini.
4. The image rollover information.
Issue: How do you identify what pigments were used in a painting?
In the physical world: In a book, dozens of numbers are printed over a painting, corresponding to tables of pigments on another page. The reader flips back and forth between the image and the data tables.
On the internet: The visitor views the painting, and next to it are a number of colored pigment squares with the pigment name and color. As they glide their cursor over the painting surface, the pigment squares flicker on and off, depending on what pigments correspond to the point just under the cursor.
Technical details: Using Macromedia Shockwave. 1) Similar to item 3 above, except you will probably want to map only about 5 pigments per image. Use transparent inks in PhotoShop to create intersection regions. 2) Create a few raw files, as above, and concatenate them into one file with a text editor (getNetText can only open one file reliably). 3) Find characters, adding the offset of the number of chars in the single raw file to extract data for each image. 4) Note that you can reduce file sizes by using half bytes instead and bit math.
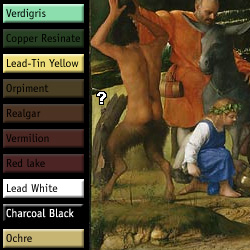
Figure 4. Bellini painted this grassy area on the left edge of the painting with: verdigris, lead-tin yellow, lead white, charcoal black, and ochre.
5. The pop-up images
Issue: How does one readily analyze painting cross sections?
In the physical world: In a book, several numbers are printed over a painting, corresponding to sample locations. On other pages in a book, photos and descriptions of the cross sections are described.
On the internet: The visitor uses a screen with a painting sample locations labeled. As they point their cursor at a sample location, the corresponding cross-section and description is displayed. Only the painting and one cross section are viewed.
Technical details: Using Macromedia Shockwave (or Flash). 1) Numerous sample sprites are distributed on the painting surface. 2) Sprite names correspond to the sample image name. 3) Load sample image from online jpeg file. 4) Load sample description from a case statement. 5) Position the image and the description over the painting, near the cursor.
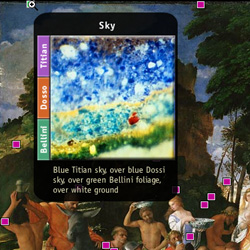
Figure 5. In this paint sample from the top left corner of the painting, we see several layers. At top is blue Titian sky, over blue Dosso sky, over green Bellini foliage, over white ground. The yellow layers were masking layers.
6. The virtual reality scene
Issue: How do we explain the historical context of artwork?
In the physical world: Visitors go to historic museums and walk around, view video, or view pictures.
On the internet: The visitor navigates a virtual reality scene, looking up, down, and around.
Technical details: Using QuickTimeVR. 1) If the place exists, a series of photographs can be stitched together with software like SoundsaVR or VRWorx. 2) If the place does not exist, collect a series of images of the artwork, the likely architecture of the original location, and photographs of related scenes. Recreate the scene, and export a panoramic movie to be processed into a mov.
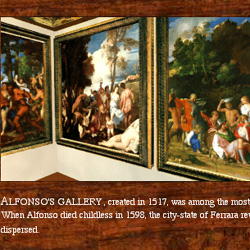
Figure 6. The Feast of the Gods is seen in this virtual reality reconstruction of Duke Alfonsoís camerino in 17th century Ferrara, Italy.
Conclusion & future directions
The above techniques have been very successful in helping make vast amounts of visual data accessible to our visitors. Our current research is focused on a related problem of condensing information when the data is more quantitative.
We are assembling an extensive database of pigment usage data for several hundred paintings. How can this mass of data be accessed? We are still working on solutions, but the goal is similar to above: display only a small portion of the data at a time. Our primary solution has been to extract "slices" from the database by performing sophisticated statistical analyses that summarize, for example, the difference between Monetís and van Goghís typical palette. Moreover, we find that it is very instructive to have numerous "predefined" database queries to answer questions like "When was Cobalt Blue used?" by clicking one button. Our current work in this area may be viewed at <http://www.webexhibits.org/pigments>.
Acknowledgments
The authors wish to acknowledge the outstanding research performed by David Bull and Joyce Plesters. Our "spyglass" was inspired, in part, by the Codex Analyzer developed by Corbis, and the Magic Window developed by Xerox.
Sources for further information
Bull, David and Plesters, Joyce, The Feast of the Gods: Conservation, Examination and Interpretation, Studies in the History of Art 40, Washington, D.C., 1990.
The Feast of the Gods, a video, National Gallery of Art, Washington, D.C., 1990.