
![]()
![]()
![]()
![]()
![]()
![]()
![]()
![]()
![]()
![]()
![]()
When is the next
Museums and the Web?
![]()
Archives &
Museum Informatics
158 Lee Avenue
Toronto, Ontario
M4E 2P3 Canada
info@ archimuse.com
www.archimuse.com
| |
Search
A&MI |
Join
our Mailing List.
Privacy.
Copyright
Archives & Museum Informatics
2000

Who's Out There? A Pilot User Study of Educational Web Resources by the Science Learning Network (SLN)
Abstract
The Science Learning Network (SLN) is a world-wide partnership of science museums created to explore the development of World Wide Web resources for school science education. Supported by the Unisys Corporation, it grew out of an initial experimental partnership of six US science museums, funded additionally by the National Science Foundation. The SLN has developed a significant number of online resources based on museum resources primarily intended for teachers and school students (http://www.sln.org). Although there is evidence that these resources are widely used by tens of thousands of users, there is little detailed understanding about who uses the resources and how they are being used. More generally, there is little understanding of the use of educational on-line materials. As the use of online learning resources for both formal and informal science learning continues to grow, it is important that producers of these materials and activities have a developing knowledge of their audiences and modes of use, and of methodologies for evaluating their use and effectiveness.
Goals of the Study
This study was designed to explore the development of an integrated methodology for evaluating the use of on-line resources, and then to pilot-test this methodology to provide information about the use of three specific SLN on-line resources.
The Exploratorium, San Francisco, produced two of the resources examined: Cow's Eye Dissection and Science of Cycling.
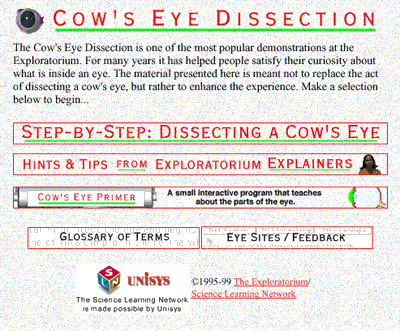
http://www.exploratorium.edu/learning_studio/cow_eye/
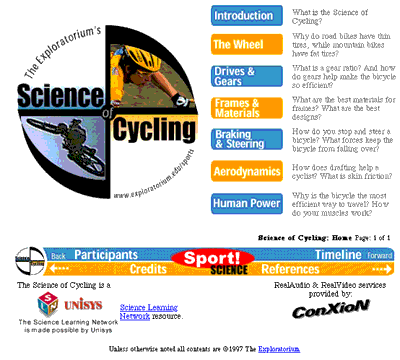
http://www.exploratorium.edu/cycling/
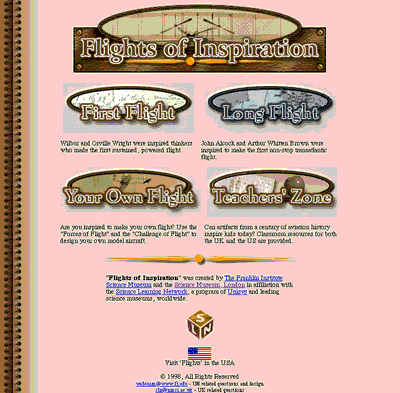
The Franklin Institute, Philadelphia and the Science Museum, London jointly produced one of the resources examined: Flights of Inspiration
http://www.nmsi.ac.uk/flights/ or http://www.fi.edu/flights/
These sites were chosen to contrast a range of likely types of use. Cow's Eye Dissection is a highly structured linear resource that was designed to be used in a step-by-step manner in classrooms. Flights of Inspiration, which (unlike the other two resources) is based on museum collections, is also designed for classroom use but is less linear, more amenable to browsing, and contains material of wider interest. Science of Cycling is presented in a particularly informal way, and was not designed primarily for use in a curriculum context, but rather as informational material for a wide audience of students, educators, and the public.
The overall goals of the study were to:
- develop an integrated methodology for evaluating web resources for learning
- establish who is using the resources and in what contexts
- find out how the resources are being used and how they might be made more effective.
Overall Methodology
The methodology developed is deliberately diverse, to provide a range of types of information about resource use that complement and illuminate each other. The techniques used were:
- server log analysis, providing detailed quantitative data on file accesses and pathways of use
- an online pop-up questionnaire, providing data on the user profile and modes of use
- follow-up telephone interviews with some questionnaire respondents to expand the data
- direct observation of classroom use and analysis.
Together, the range of techniques, from wholly mechanical and quantitative to individually human and qualitative, provides a rich inter-locking picture of use.
There is little published evaluation of online learning resources, although an extensive analysis of use of the Why Files, using server data and online survey, has been published (W. P. Eveland and S. Dunwoody, "Users and navigation patterns of a science World Wide Web site for the public" Public Understanding of Science 7, (1998) 285-311). A further relevant paper examining visitors to a museum website was presented at the Museums and the Web Conference in 1999 (J. Chadwick and P. Boverie, "A Survey of Characteristics and Patterns of Behavior in Visitors to a Museum Web Site" Museums and the Web 1999, http://www.archimuse.com/mw99/papers/chadwick/chadwick.html).
Log Analysis
Web site logs contain a wealth of information about how the Web site is being used. Each time the Web server responds to a particular request from a browser, for example to view a new page, download some data or input some text, it records to its logs a series of data about the request and the requesting host computer. By analyzing the log files it is possible to learn a great deal about the type of person using the web site and how they make use of it.
For this project, we analyzed the log files for these resources for a five week period of 1999 (November 14th through December 18th). This is over the same time frame as the on-line questionnaire was on-line (see below). The specific log records for the three SLN resources of interest, The Cow's Eye Dissection (Cow's Eye), the Science of Cycling (Cycling) and Flights of Inspiration (Flights) were isolated from the general Web site log files of the Exploratorium, the Franklin Institute and the Science Museum (NMSI), London. Because the Flights Web site was running on both the Franklin Institute's and the Science Museum of London's server, we analyzed four log files in total. These two Web sites were cross-linked at the top page (i.e. users who entered the Franklin Institute Flights top page could like to the UK version and vice versa.) In some cases, where appropriate, the data were merged between the two different log files for Flights.
These logs were analyzed using the software package Summary Pro (version 1.4.1) from Summary.Net (http://www.summary.net)which provides over 100 reports detailing Web site operation. (See the report list in Figure 4.)
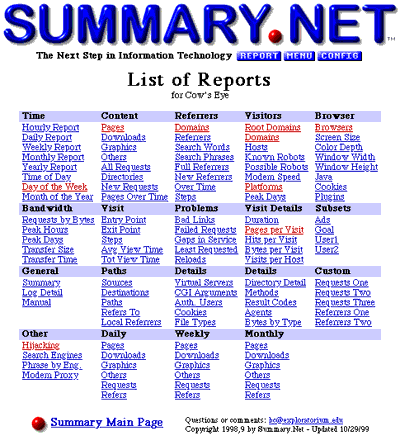
Figure 4 Summary.Net reports
This analysis software can show information about the host computer requesting access, the navigation path that the visitor takes through the site and the length of time for the visit. It is also possible to get information about how the visitor was referred to the site, the search phrases that were used to find the site, the speed of the connection, and even the type of browser and operating system which the visitor used.
The results we are reporting on here are based on a preliminary analysis of the use of these SLN resources. Because the connectivity on the Internet is complex and often convoluted, it is often hard to determine with precision any particular result or what any result actually means in detail. At best log analysis should serve as a general guide to what is going on. Nevertheless we believe that these initial results can be highly informative about the current state of the use of educational resources on the Web.
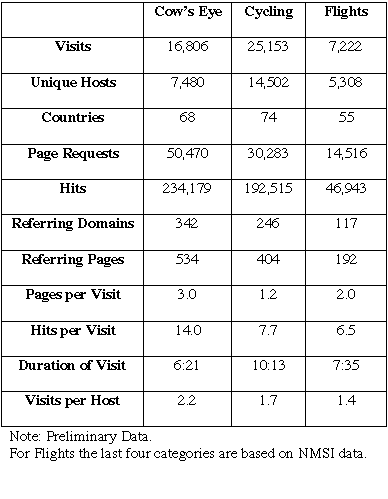
Figure 5 Summary table of log analysis
Figure 5 provides a summary of the log analysis data for the three resources. For this analysis, a visit is defined to be a sequence of requests all made from the same IP address with no gaps exceeding 30 minutes. It is important to remember that some visits are actually from Web sites that have cached the site at other locations where additional users will access the material. This means that the visits number typically underreports the number of people who have accessed the resource. A unique host is a distinct IP address that is requesting access. In some cases a number of users will use the same host at different times and so this number undercounts the number of individuals accessing a particular site. This is why the visits number is higher than the host number. Countries indicates the number of individual countries as shown by the root domain name making a request for the Web page.
A page request is a request for an individual page. A hit is a single request to the Web site for a page, a graphic element or a link to a new page. Loading a single page can generate many hit requests. A page with a lot of graphical elements will generate more hits than a page that is composed of mostly text or a few images. Referring domain and referring pages indicate the most recent URL that the Web browser was pointing to before it came to this resource. The pages per visit and hits per visit are average numbers. The duration of visit indicated the average visit length in minutes. The visit per host indicates how many users on average have accessed the resource from the same host.
Who are the visitors using these resources?
Analyzing the root domain address data provides an initial view of the user community. The root domain is the part of the address which indicates that the host computer for the connection comes from a com, edu, org, net, mil or gov (in the US mostly) server or a server in a specific country like us, ca, uk, etc. Because there is no direct tagging of individual users on the Internet, one has to make an educated guess about users' identities through analyzing the host IP addresses. This is akin to determining who the public museum visitors are through analyzing their zip code. For the Web, the IP number and the domain name is the key piece of information.
Figure 6 shows the distribution of the top 15 root domains for each resource (out of a total of about 70 different root domains for each resource).
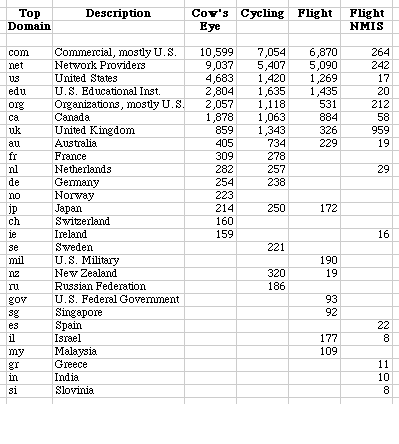
Figure 6 Root domain distribution
Because of the history of Web development and the pattern of domain creation on the Internet there is disproportionate weighting to com, net, us, edu and org (the first five categories in terms of access on the chart.) While there is general similarity in root domain access for the different resources, there are some interesting differences between institutions.
The root domain data serves to give only a crude idea of the background of the users. But the next level of domain information begins to provide enough detail to become interesting. The following set of figures show the top 20 requesting domains for each of the three resources.
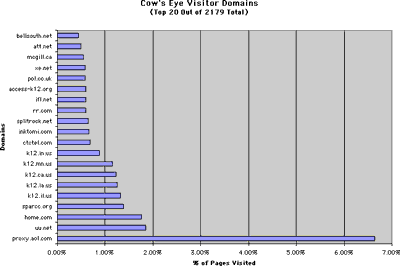
Figure 7 Cow's Eye requesting domains
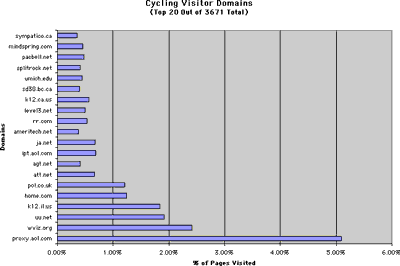
Figure 8 Cycling requesting domains
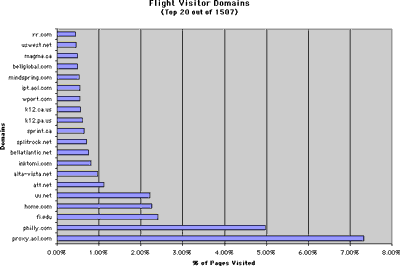
Figure 9 Flights requesting domains
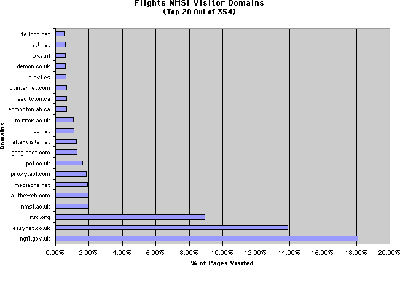
Figure 10 Flights-NMSI requesting domains
One interesting question to ask is how much are these resources are being used directly in school classrooms compared to the more informal use by individuals (including students and teachers) from elsewhere. While there is no easy direct way to determine this information, it is possible to make some inferences by looking at the difference in domains. Of the top 20 domains for Cow's Eye, at least 10 can be recognized as serving schools in some way (a k-12 or a statewide school network for example). For Cycling, the number appears to be closer to 5. While some schools may be using commercial networks or getting their access in different ways this difference still makes some sense given the explicitly curricular nature of the Cow's Eye activity compared to the more informal aspect of Cycling.
Another interesting aspect to note is the enhanced European focus of the users of the NMSI version of Flight. This is evident in the number of European ISP's that are in the NMSI top 20 as well as an interesting country skewing in the root domain list.
When are the visits happening?
The logs can also provide information about when the visits are happening. The next chart shows the distribution of visits during the week for each resource.
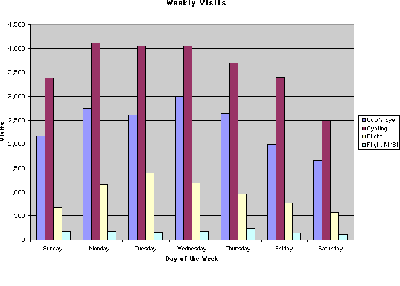
Figure 11 Weekly visit analysis
The distribution appears to be roughly similar for the different resources. The distribution follows the general trend of higher access during the week (the assumption is that more people have access to high-speed connectivity at school or at work.) One interesting observation we discovered is that the weekend drop-off of page views is less pronounced for the UK Web site. Upon further investigation, we learned that the National Grid for Learning, the major UK educational access system for on-line education does a major download of Web resources every Sunday which accounted for much of the increased Sunday activity.
How did the users find these resources?
The next set of figures show the referring domain data for each of the resources. These addresses show where the browser was just before coming to the resource.
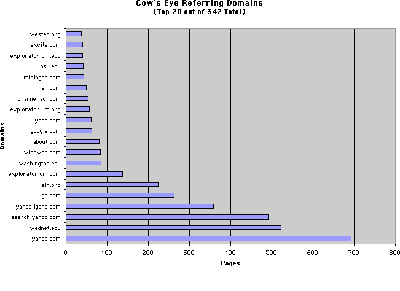
Figure 12 Cow's Eye referring domains
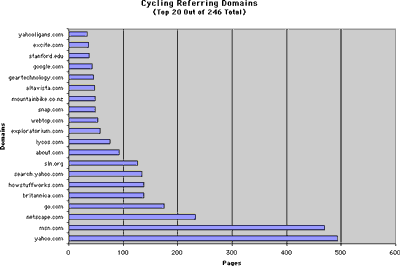
Figure 13 Cycling referring domains
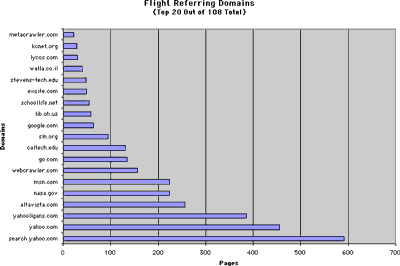
Figure 14 Flights referring domains
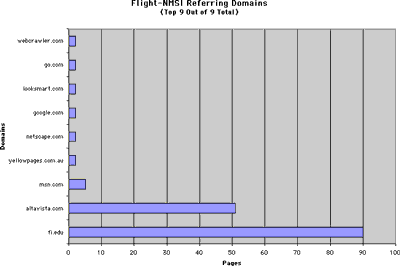
Figure 15 Flights-NMSI referring domains
There are a number of interesting things to note in these charts. The total domains referring to these resources are between 100 and 350 illustrating the widely distributed nature of Web activity. The referrals come from other locations on the resource hosting Web site (exploratorium.edu, fi.edu etc), SLN's home page (sln.org) and many external Web sites. Some of these external sites are search engines (i.e. search.yahoo.com) others are collectors of educational Web sites (i.e. washington.edu, wested.org, lib.oh.us). It is also interesting to note the amount of traffic that is driven to each resource from the sln.org Web site.
What did the visitors do at the site?
The logs also provide information about the visit itself. Information is available about the path the user followed, the graphics that were downloaded and the exit point from the resource. This data is too extensive to present in this paper, and will require further in-depth data analysis. But there are a few interesting things that can be easily shown. The first is the average duration time of the visit. The next figure shows the duration in time bins measured in seconds.
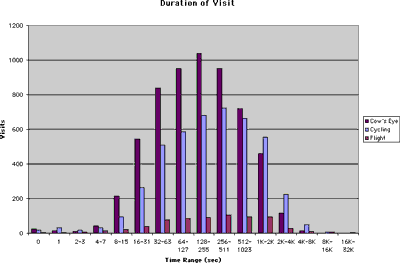
Figure 16 Visit duration distribution
Notice that the time scale is not linear but rather geometric because of the method of obtaining the data by the log analysis software. The duration for each of the resources averages between 6 and 10 minutes. (The data for the two Flight resources has been added together.)
The analysis of number of pages per visit is shown in the next chart. (The two flight resource hosts' data were summed for this analysis.) Here the x-axis shows how many additional pages are requested after the entry page. While the large number of 0 additional pages clearly shows the browsing feature of the Web, the long tail of the data indicates that some people do in fact view a lot of the material further "down" in the resource.
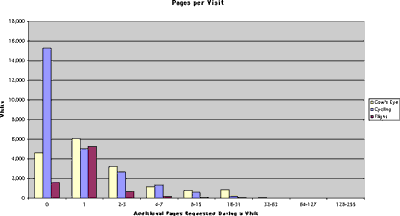
Figure 17 Page per visit distribution
These charts only show the barest fraction of the log data reports that Summary is capable of producing. Clearly, this data will reward careful further analysis. We will continue to mine this data for information on user behavior with the goal of producing better, more useful educational resources, both for school audiences and for the general public.
Online Survey and Follow-up
For this part of the study an online survey was produced.
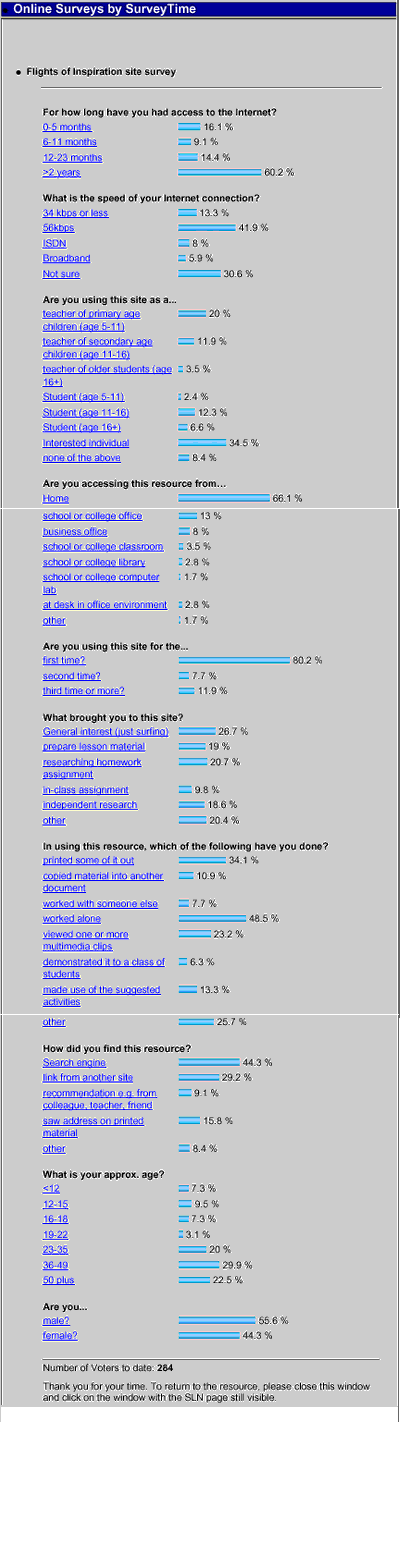
Figure 18 On-line survey
There were 10 questions, some of which allowed more than option to be selected via a drop down menu while others used radio buttons restricting users to single choices. Free-form text fields were avoided to ensure all data could be summarized numerically. At the end of the questionnaire respondents were asked to supply their email address if they were willing to be contacted for follow up interviews to provide more qualitative free-form data.
The questionnaire appeared as a separate pop-up browser window, triggered from the homepage only of each resource, so as not to interfere with user experience of the resource. Respondents were requested to continue browsing or using the resource and to return to the questionnaire window at the end of their session. After submitting their responses they were presented with a screen summarizing the responses collected to date. They could therefore see their own response in the context of those of previous respondents.
Data were gathered from each of the three sites during the period 17 Nov - 19 Dec. The data were stored on a server run by the Web company, which coded the questionnaire. The link to the pop-up window questionnaire from each of the sites was removed on 19 December and the data downloaded for analysis. The next figure shows the number of respondents for each resource.
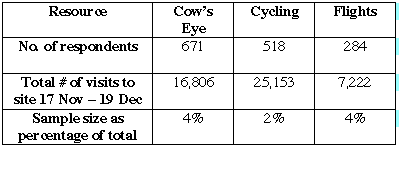
Figure 19 On-line questionnaire summary data
Results
The questionnaire was designed to focus on the following aspects of the visitor:
- Who are you?
- Why are you using this resource?
- How are you using this resource?
The results of the survey are presented below under these categories.
Who are you?
The relevant questions here are those relating to age, gender, number of years on Internet and the bandwidth of their Internet connection. These questions helped to set subsequent data in context, as well as sampling and comparing the audiences of the three sites.
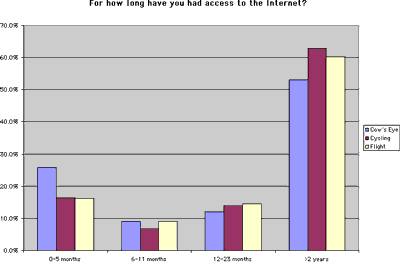
Figure 20 For how long have you had access to the Internet?
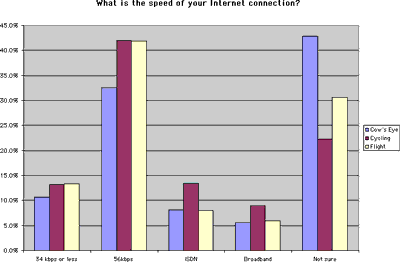
Figure 21 What is the speed of your Internet connection?
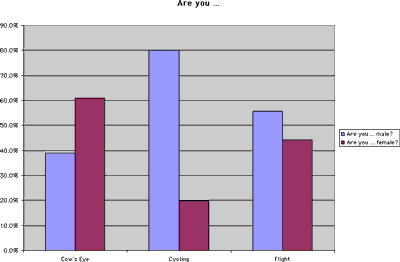
Figure 22 Are you male or female?
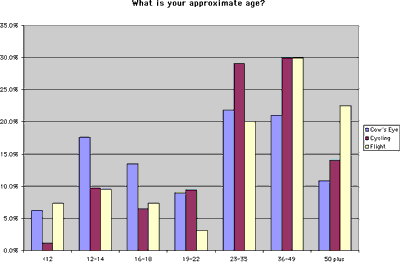
Figure 23 What is your approximate age?
Key findings
Across all three sites it was found that 50-64% have used the Internet for more than 2 years and 51% of users were aged 23-49. Though the respective percentages for both ISDN and broadband were small, when added together for each resource, they seem to indicate that a significant percentage of visitors (14-22%) now have access at speeds faster than 56k. This could have impact on design decisions about whether to include streaming media or large files in web resources. Around 40% of users were on 56k Internet connections, but a significant proportion was unsure. Averaged across all three sites, there was a 58/42-male/female split, but there were significant differences between the individual sites.
Cow's Eye attracted the highest proportion of 'newbies', reflecting perhaps the higher proportion of use by younger students. 61% of users were female, 46% of them under 22.
In contrast Cycling's principal users describe themselves as 'interested individuals', 80% of them were male, 84% over 22 years old and significantly more experienced on the Internet than the Cow's Eye users.
Flights users lie between these two extremes in most respects, but had the largest proportion (23%) of over 50s users, perhaps because of the strong historical content.
Why are you using this resource?
The main aim here was to gain a sense of how often these resources were used educationally and in what type of setting. The relevant questions were "are you using site as a�.(type of user)?, "what brought you to this site?", "from where are you accessing this resource", "how did you find this resource" and "is this the first/second/third time you have used it?"
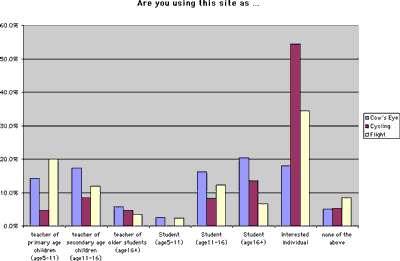
Figure 24 Are you using this site as a ...?
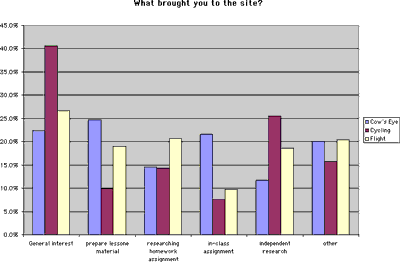
Figure 25 What brought you to this site?
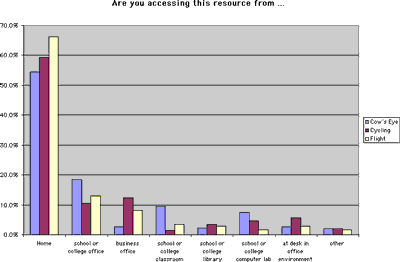
Figure 26 Are you accessing this resource from...?
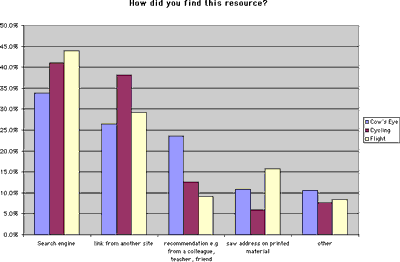
Figure 27 How did you find this resource?
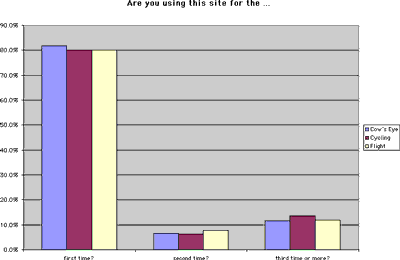
Figure 28 Are you using this site for the ... ?
Key findings
On average about half of access (55-66%) was from home. All sites were being used for the second time or more in 15% or more cases. Of the three, Cow's Eye was being most extensively used in explicitly educational settings (38%), especially with secondary and post-16 classes. Cow's Eye also has the most well defined audience, with the smallest proportions classifying themselves as 'interested individual' or 'none of the above'. By contrast Cycling was being used least often in an explicitly educational setting (20%). This would seem to support the finding in "Who are you?" above, that its principal users describe themselves as 'interested individuals', mostly over 22 years old and experienced on the Internet. Flights was used in educational settings by 21% of users. It was most frequently found using search engines, probably because it is the most recent site and because of popular search terms such as 'flight''
How are you using this resource?
The emphasis here was on finding out what people had actually done with the resource.
Key findings
As a general summary, around 45% stated that they worked alone and 9% worked with someone else. On average 15% made use of the suggested activities, 10% copied material into another document and nearly a quarter (19-26%) viewed
multimedia clips. Cow's Eye was demonstrated to whole class twice as often (11%) as the other two. The site was designed for this purpose and its use appears to reflect that design. Surprisingly Cycling had less use of 'multimedia clips' than in Flights, which has almost none. This may reflect a problem with the phrasing of the questionnaire, or with user understanding of the term "multimedia". Flights was much more frequently printed out than Cow's Eye. In general this proved to be the least satisfactory question (on the face of it, the total of those who worked alone and those who worked with someone else should total 100%!). The follow-up by subsequent phone interview was designed to expand on this area in particular.
This questionnaire technique will be developed further for the evaluation of online resources, and could be redesigned to focus more on the uses to which the resource is put and subjective comments on effectiveness.
Follow up Interviews
Respondents who left their email addresses as part of the survey were contacted and telephone interviews arranged, in which all the online questions were run through again, probing in more detail where appropriate.
These were carried out after the submission of this paper and will be reported at the conference itself.
Classroom Evaluation
Classroom evaluation was carried out in two phases in the UK: Phase 1 September-December 99 in primary (elementary) schools and Phase 2 January - March 2000 in secondary (high) schools.
Classroom evaluation mirrors the type of user evaluation carried out in the initial development of a web resource, providing highly specific feedback on factors such as attractiveness and usability. Any findings that are relevant to the wide picture of use built up through the varied overall approach described in this paper will be presented at the conference itself.
What Does it Mean? Initial comparisons of the user surveys and log analysis
By comparing of the two data sets, a number of interesting connections appear, leading to some hypotheses, and many further questions for research. The scope of the project to this point has not involved an in-depth statistical analysis of the data sets, or the correlation between them. Such an analysis will be part of future research based on this pilot. (Further insight could be gained from comparisons between the quantitative data outlined here and the qualitative information gleaned from classroom observation and telephone interviews with smaller subsets of questionnaire respondents. The results of the pilot classroom observation and user interviews will be discussed at the presentation of this paper at MW2000)
Some of the possible hypotheses and questions suggested by a first look at the pilot study data are outlined below:
Information design/navigation has an impact on educational use versus other use
Why are some resources more successful in classroom settings than others? Both the questionnaire and the log analysis seem to suggest that the Cow's Eye resource had a larger proportion of classroom educational use. The large number of clearly educational domains (5 out of the top 20 visitor domains) in the visits to resource seems to fit well with the large number of respondents who identified themselves as explicitly educational users (38%). It is worth noting that there may be more educational domains visiting the sites, since not all schools get internet access through a k12 or .edu domain. Cow's Eye was followed by Flights, with Cycling having the least number of clearly educational domains visiting, and the least number of respondents claiming educational use. Cycling also had the highest share of users identifying themselves as simply "individual".
One possible explanation for this difference could be the design of the resources: Cow's Eye is quite linear, with a set of instructions for step-by-step use, which may make it quite adaptable to use in a traditional classroom or curriculum. Flight has a certain amount of explicitly educational material, designed for classroom use, while Cycling has very little, requiring flexibility and adaptation for use in a standard curriculum. Alternatively, the difference could due to the content of each of the resources: perhaps the Cow's Eye Dissection is a natural part of a life-sciences curriculum, while the Science of Cycling fits less neatly into a physics or other curriculum, requiring more adaptation or flexibility from teachers and students. This question will be explored through further observation of classrooms and discussions with teachers.
Use of resources in educational settings yields longer visits and more focused use.
Why do some resources receive longer visits than others do? The distribution of the length of use curve is roughly the same for all three resources, though the length of use. The length of visit for Cow's Eye shows a preponderance of users who stayed for between 1-8 minutes, a much longer duration than the other two resources. Since both the questionnaire and the Summary data on visitors' domains suggest that Cow's Eye is being used in classrooms to a larger extent than the other two resources, it is possible that the length of use is a result of use as a classroom resource, for research and assignments, instead of a "browsing" site for casual users. Another possibility could be that the linear design of Cow's Eye invites and rewards sustained visits, as opposed to the more modular approach of the other resources.
The role search engines play in brokering Web site visits
How do people find a given web resource? Both the questionnaire and the log analysis seem to suggest that search engines or portal sites play a crucial role in bringing visitors to a given resource. Since roughly %40 of questionnaire respondents indicated that a search engine had brought them to the site, and given the repeated appearance of search engine/portals like msn.com, yahoo.com, and netscape.com in the top referring domains for each resource, the role of search engines seems established. This seems to suggest that a strong understanding of how search engines create their indexes could help in the creation of successful resources, resources that can be found amidst the clamor of competing information on the Web.
These questions are clearly only starting points, and there are many others to be generated from the examination of the various data sets gathered during this project. Each of these questions could support a separate research effort. One of the goals of this pilot was to evaluate the usefulness and feasibility of more research of this kind; it seems clear that such research will be worthwhile.
Conclusions: Towards a template for evaluation of educational websites
When designing this pilot, we chose to gather and examine many different types of data over a relatively brief period. The rationale was that by doing this, the strengths and weaknesses of each type of data could complement each other, producing insights into user behavior, preferences and patterns of use. Ideally, this multi-faceted data should help to identify "who's out there" and what use they are making of the educational resources like those produced by SLN museums.
During the course of the study, each data type has revealed strengths and weaknesses. Some of these weaknesses should lead to a revision of the process for future studies. On the whole, what we have seen in this pilot seems to strengthen the argument for this model of a multi-faceted user research study.
Log analysis
Log analysis is a method that yields a great deal of quantitative data on file accesses to the resource. No "cookies" or personal information are gathered. This method has the advantage of neither invading the privacy of users nor disrupting the user's experience by requiring the user to choose to participate in a study. Data can be gathered on every user who visits a site, giving a broad and in some ways complete picture of use. However, the anonymity of the data makes interpretation difficult. If a given user stays in a resource for only 30 seconds, we will never know why she left: had she found what she wanted? Had she been irritated by confusing navigation? Was she bored? Without recourse to more in-depth and qualitative data, we will never know. Thus the weakness of log analysis is largely a lack of depth.
The choice of analysis software has an impact on this type of data: different programs use different methods to generate reports on log data, which can confuse results when compared with reports from other software.
Online questionnaire
The online questionnaire generates quantitative data on specific user's identity, purpose and modes of use. This form of quantitative data adds depth to log analysis, by asking some of the questions missing from log data: who are you? Why are you here? What are you doing? The strength of this method was that it gathers a greater depth of information than log analysis, while still gathering a large enough sample to be significant, without a huge outlay of time by researchers.
The weaknesses of this method are again lack of depth, and they are the result of the technological solution we chose to administer the questionnaire. In order to create a questionnaire which could generate numerical results dynamically from a database program, we had to choose questions which could be answered by choosing from a pull-down list of possible options, or by checking a series of "radio-buttons" for each response that was applicable. Thus we limited the range of possible responses a participant could choose, and we did not allow for any elaboration. Allowing participants to type their responses into a text field would have allowed for a full range of responses, though it would have required an elaborate effort to read, sort and code the responses into numerical data.
The "multiple-choice" format was also chosen in an effort to limit the time the questionnaire would take, thereby hopefully increasing ease of participation. For any voluntary survey, participation levels are a concern, especially on the web, when less demanding sites are only a click away. In order to encourage participation, the questionnaire did not ask for specific personal information, protecting the privacy of the users. It was also designed so the respondent could see his/her own responses in the context of all responses to date, thereby enabling the respondent to be a more active participant and providing a small "carrot" for participating.
Thus the choice of possible responses offered to the users becomes crucial to the success of any such questionnaire. By failing to offer a relevant set of choices, or by choosing responses that are too general, the effectiveness of the question is severely limited. Several of the questions from the initial questionnaire will be revised for future research efforts. (By administering a questionnaire on the web, such iterative trials and revisions are easily carried out.)
The weaknesses or limits of the questionnaire may be addressed through telephone follow-up and classroom observation.
Follow up interviews
These interviews are currently being carried out. The decision to undertake these interviews was largely based on the results of the log analysis and the questionnaire: given the limits of the two quantitative data sets, we sought the ability to probe user experience in a more open-ended and responsive way. So when a user says, "Oh, your site bored me," or "It was useless in my classroom," we can ask "why?" Instead of being limited to the category of "other", responses that don't fit our pre-conceived categories can be looked at in detail. By limiting our interviews to questionnaire respondents who volunteered for further conversation, we may skew our results somewhat, but we should gain insight into the blank spaces left by other data types.
Classroom observation
This is essentially an 'ethnographic'-type of study. For each classroom, the observer needs to be aware of the lesson content a teacher is trying to convey, and how it fits into the overall scheme of work in that classroom and the school and school system as a whole. Educational systems and curricula vary widely from country to country, and from state to state within the United States, and this can have a strong effect on how given resource is approached, and even on how computers and networks are viewed and implemented within the classroom. (A teacher whose class can use computers only in a "computer lab", far away from other materials and tools will find a web resource that contains recipes for student experiments far less useful than a teacher who has computers in the classroom. A sobering possible scenario for the apparent educational "success" of the Cow's Eye Dissection is that it lends itself easily to a computer-lab environment.)
As we move forward with this pilot study, we will develop a protocol for in-classroom evaluation, with brief follow up discussion(s) with the teacher. This will enable us to gather in-depth qualitative data (stories) reflecting how a given web resource is successfully or unsuccessfully used in a classroom setting.
The Invisible Web Visitor: Moving towards understanding the audience
By combining log analysis with questionnaires and log analysis and user observation/interviews, insights may be gained into the stories behind the numbers, while the numbers help to place the stories into the context of the entire use pattern for that resource. From our experience with this pilot study, this form of multi-modal research into web resource use is an extremely rich source of information, one we have only begun to explore. The information we gathered begins to reveal a picture of a previously invisible audience, and may yield valuable guidance for on-going efforts to create web resources, which serve the educational and public audiences of museums.
Acknowledgements
The authors would like to thank Unisys Corporation and especially David Curry, VP of Corporate Affairs for the strong support they have shown for this project and their major continual financial and intellectual support for the entire Science Learning Network over the years. We would also like to thank the many museum members of the Science Learning Network for their insight and encouragement and the Web design and operation staff of the Exploratorium, Franklin Institute and the Science Museum of London for their work in the development of the resources we have analyzed for this project.
The log analysis section of this project could not have happened without the great support of the Web administrators at each of our institutions. We want to acknowledge Katie Streten, Web Site Manager at the Science Museum, London and Karen Elinich, Director of Educational Technology Programs at the Franklin Institute for generously and quickly providing their data logs for analysis. At the Exploratorium, Ron Hipschman and Larry Shaw helped with data analysis, Jim Spadaccini with the questionnaire development and our special thanks to Bill Carson who managed to wrangle the data into usable form and keep summary.net running.