
![]()
![]()
![]()
![]()
![]()
![]()
![]()
![]()
![]()
![]()
![]()
![]()
![]()
|
158 Lee Avenue ph: +1 416-691-2516 info @ archimuse.com Join
our Mailing
List.
published: March 2004
|

Bringing Mars Home: the MarsQuest Online Project
James B. Harold and Paul B. Dusenbery, Space Science Institute, USA
In October, 2000, the Space Science Institute of Boulder, Colorado, launched MarsQuest: a 5000 square foot traveling exhibit on Mars and Mars science. Two years later NSF and NASA gave their support to an associated Web project called MarsQuest Online, a partnership between TERC, the Space Science Institute, and JPL. The goal of the MarsQuest Online project was to create a Web site that extended both the reach and scope of the traveling exhibit. The program was premised on the idea that the effort expended on the museum exhibit - the exhibit framework, interactive concepts, educational goals, etc. - could be leveraged into a highly interactive on-line experience.
While still in development, the site (http://www.marsquestonline.org) has already been quite successful on a variety of fronts. It provides a wide variety of activities, from 3D flyovers to drivable rovers, reflecting the learning goals of the original exhibit. We've also found that selected interactives, repackaged into a stand-alone kiosk piece, can be popular in small venues (for instance, the local planetarium during the recent Mars opposition). This paper will discuss the evolution of the project, our successes (and challenges) in attempting to leverage from a physical exhibition, and the ongoing evaluation program. The evaluation, which includes interviews, database driven usage tracking, and log analysis, will test not only the usability of the site, but also its effectiveness in meeting our educational goals as compared to the original MarsQuest exhibit.
Keywords: Mars, science, exhibits, on-line activities, public Web site
Introduction
We are living in an extraordinary era of Mars exploration. By the standards of planetary missions, a veritable flotilla of spacecraft has been sent to Mars, and it is profoundly changing our understanding of the planet. Nor is this exploration likely to end soon: over the next decade, the U.S. and other nations will send increasingly sophisticated spacecraft to explore Mars.
This ongoing exploration of Mars presents a tremendous opportunity to engage and inform the public. In the fall of 2000, the Space Science Institute (SSI) capitalized on this opportunity by launching MarsQuest, a 5000 square foot traveling exhibit for museums and science centers.Ā Two years later NSF and NASA gave their support to an associated Web project called MarsQuest Online, a partnership between TERC, the Space Science Institute, and JPL. The goal of the MarsQuest Online project was to create a Web site that extended both the reach and scope of the traveling exhibit. The program was premised in part on the idea that the effort expended on the museum exhibit - the exhibit framework, interactive concepts, educational goals, etc - could be leveraged into a successful, highly interactive on-line experience.
Now nearly complete, the MarsQuest Online Web site consists of several distinct areas, each with a somewhat different target audience and approach.Ā Here we focus on one of these areas: Explore Mars, a section of the site modeled after the MarsQuest exhibit.Ā In this paper we will introduce the original physical exhibit, and describe the evolution of the project to create an on-line extension of it.Ā Finally, though summative evaluation has not begun, we will discuss some preliminary results based on data collected through the Web site.
The MarsQuest Exhibit
With major funding from the National Science Foundation and NASA, the MarsQuest exhibit was designed to bring a new age of exploration to the public by taking visitors to several important destinations on Mars. Like sightseers in a national park on Earth, they see some of the wonders of Mars, such as the solar system's largest volcano and a canyon as long as the continental United States. Along the way, interactive exhibit components introduce visitors to the methods that scientists use to explore Mars and reveal some of what they have discovered.

Figure 1: The canyons area of the MarsQuest exhibit, showing several interactives as well as the Valles Marineris mural.
The MarsQuest exhibit has two overarching themes: Mars exploration, and comparisons between Earth and Mars. It is organized around five goals:
- to present basic concepts about Mars' history, climate, and suitability for human exploration in an interactive, engaging context
- to teach Earth science by using Earth-Mars comparisons
- to increase understanding of science as a creative process of investigation
- to inspire interest in scientific exploration by personalizing the use of science and emphasizing the thrill of discovery
- to develop a stimulating learning environment that reaches people of diverse learning styles and backgrounds, especially those groups traditionally underrepresented in science.
The exhibit uses data from various NASA missions to surround visitors with large-scale murals of the exhibit's destination sites on Mars. This multi-media exhibit includes sixteen interactive components for hands-on learning experiences; five computer stations where visitors navigate through virtual presentations, manipulate computer models, or find information; a video monitor that plays a brief animation of the formation of our solar system; seven scale models depicting spacecraft and portions of Mars and Earth; and the Mitsubishi Digital Imagination Theater, which presents a video of high-definition images of Mars.
Examples of the interactive components include the Hot & Cold Globes, in which two copper hemispheres demonstrate the relative sizes of Earth and Mars and the differences in their surface temperatures. Visitors may touch the almost freezing Mars globe and compare it to Earth, which is cool at the pole and warm along the equator.

Figure 2: The Hot & Cold Globes interactive in the
MarsQuest exhibit.
This is a good example of a successful museum interactive
probably not worth attempting to reproduce as an on-line experience.
At the Rover Test Bed, in order to drive a model rover over simulated Martian terrain, visitors upload a series of commands to the rover's computer. This is the same process that NASA scientists and engineers used to drive the Sojourner rover on its exploration of the Pathfinder landing site.
Thematically, the exhibit is structured around sites on the planet.Ā Early on in the development process, it was decided to treat the planet in the way you would a National Park.Ā Rather than discussing prospects for colonization, for instance, we asked the question: If you were a tourist, where would you go?Ā As a result, the exhibit was focused around locations of compelling interest: Volcanoes, Canyons, and Rover Landing Sites/Floodplains (at the time, the only rover mission was Pathfinder/Sojourner, which landed in an ancient floodplain). The exhibit components in each site expand on the dual themes of Earth-Mars comparisons and Mars exploration.
MarsQuest fared well in its summative evaluation, performed by Randi Korn and Associates (Korn, 2002).Ā Visitors moved more slowly through MarsQuest than visitors in exhibits of a similar size.Ā In interviews, visitors enjoyed the exhibit and were able to articulate at least part of the exhibit's message.Ā They recalled specific facts about Mars, and commented on Mars-Earth comparisons.
MarsQuest's initial tour was three years, during which it visited 9 museums and science centers across the country.Ā In the fall of 2003, the exhibit was pulled in for refurbishment. It began its second three-year tour in late January of this year at The New Detroit Science Center, complete with new interactives and a full-scale model of a MER rover. The exhibit now also contains a kiosk with selected activities from MarsQuest Online, which (besides advertising the site) will provide us with an opportunity to compare usage of these pieces in different environments.
Leveraging the Exhibit: MarsQuest Online
The idea for the MarsQuest Online partnership developed independently on two fronts.Ā SSI was pursuing support for a Web site based on the exhibit, while TERC was pursuing support for an educational Web site on Mars. Eventually TERC contacted SSI, and a joint proposal to the Division of Elementary, Secondary and Informal Education of the National Science Foundation was submitted, with TERC as the project lead.Ā TERC had also developed a relationship with a group inside NASA's Jet Propulsion Laboratory (JPL), and they formed the third partner of the project.Ā The Principal Investigator is Dan Barstow (TERC); co-Investigator's are Paul Dusenbery (SSI), Paul Andres (JPL) and Eric DeJong (JPL).Ā Chris Randall is the project director at TERC, and James Harold is the project director at SSI.Ā The proposal was submitted to NSF's Informal Division in part because of the connection with the exhibit, but also because we were strongly advocating the Web as a potentially powerful informal learning environment. This is a view that has been gaining momentum as Web technologies allow more interactive and engaging experiences.Ā In fact, the Association of Science and Technology Centers (ASTC) gave its year 2000 award for innovation not to a physical exhibit, but to the Exploratorium's Web team (ASTC, 2000)
The original proposal described a site with two major areas: a Virtual Exhibit, containing short-duration activities, and an area containing longer duration guided inquiries and investigations.Ā In the Virtual Exhibit visitors were to pan through an image of the exhibit, clicking on areas of interest.Ā This would lead them to various light on-line activities, similar in content and complexity to those found in the exhibit.
The Investigations would be more complex activities that tied to the Virtual Exhibit.Ā The hope was that people would be engaged by the Exhibit, and then pursue more sophisticated questions through the Investigations.Ā In this way we could not only serve audiences with different levels of sophistication, but also move people from a novice to an intermediate or advanced level of understanding.Ā
As is usually the case, the project evolved significantly.Ā In the end, the Virtual Exhibit became Explore Mars, still modeled after the exhibit, but using a different approach. The Investigations became Mars Mysteries, activities that were less complex than originally envisioned, though still more complex than the Explore Mars.Ā Finally, a third major area was added to provide real-time access to imagery from the new NASA rovers.Ā This piece includes a navigable, high-resolution panorama that allows visitors to explore the rover findings in a visual context (http://www.marsquestonline.org/mer/mer_viewer.php).
So in the end, the MarsQuest Online site consisted of three major pieces: Explore Mars (modeled after the MarsQuest exhibit); Mars Mysteries (more involved pieces that ask the visitor to solve puzzles); and Rover Images (real-time data from the MER rovers).Ā Minor areas include resource materials for teachers and the public.
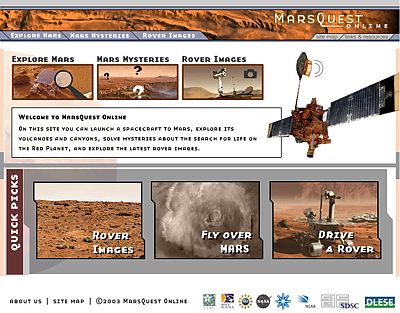
ĀFigure 3: The MarsQuest Online home page, showing the three major site areas, as well as the 'Quick Picks' shortcuts to particular activities (http://www.marsquestonline.org).
For the remainder of this paper we will focus on the Explore Mars section.Ā Its intended connection with the MarsQuest exhibit created unique challenges, as well as ultimately guiding the development process along a particular path.
Choosing an Audience
The most frequently asked question by our advisory committee, evaluators, and partners was, 'Who is your audience?'Ā While a perfectly reasonable question, it led to some confusion and a great deal of discussion.Ā Exhibits can be designed to target the population that typically visits museums and science centers.Ā That population is well defined, and has the added advantage that you can easily locate it for evaluation purposes.Ā The Web, by contrast, contains a vastly more diverse audience.Ā Science center visitors are certainly a part of that audience, but a relatively small part.Ā Visitors to this site could be expected to cover a wide spectrum, from true 'Mars geeks' at one end, to those who arrive at the site entirely by accident (one search engine hit resulted from a request for '3D model of a fly', delivering the user to our page containing 'Fly in 3D over models of Mars').Ā More questions then arise. Do you intend to design for that larger audience?Ā Are you trying to attract people with no prior interest in science?Ā Or are you catering to the science choir: the people that will hover over their computers for the duration of the next big space mission event? Do you simply build what you want, and assume that somewhere on the Web, somebody will be interested ( given the number of people on-line, this is probably true).
Ultimately, the development team decided to focus on the center of this spectrum: the 'science attentive' audience.Ā This group is comparable to the science center visitorship: they are people with a general, if not obsessive, interest in science.Ā There were three basic reasons for this decision:
- The science attentive audience is a sensible middle ground for achieving our goals.Ā Focusing our efforts on those already deeply interested in Mars wouldn't be the best use of the funds of NSF, which seeks to increase the number of people familiar with science topics.Ā Conversely, focusing on those with no interest in science is a higher bar than we were willing to attempt.
- This audience has at least some overlap with the audience the exhibit was designed for.Ā Since our intent was to leverage as much as possible from the exhibit development, it made sense to target a similar audience for the Web site
- Operationally, it was the only way to accomplish our evaluation goals. If we chose this group, our evaluators could go to a local science center and recruit visitors to participate in the evaluation.Ā To cast a wider net would have made it prohibitively difficult to actually locate potential study candidates.
Design Approach
The most significant change to the original Mars Tour concept was to abandon the idea of using floor plans or panoramas of the exhibit as an organizing structure.Ā By the time the project was funded we had developed some experience with that approach through SSI's Space Weather Center exhibit, a small (800 square foot) exhibit on the sun and sun-Earth connections (Dusenbery, 2002).Ā For its Web presence we had built a navigable QuickTime VR environment that allowed visitors to explore the exhibit, clicking on text panels and videos when they found items of interest (http://www.spacescience.org/SWOP/SWCV/1.html).Ā What became clear was that Web site users who had never seen the exhibit (which constitute the vast majority of visitors) did not particularly care about the exhibit layout, nor was it an intuitive framework for them.Ā As a result, the development team decided to develop the MarsQuest Online site in a way that did not make explicit reference to the physical layout or structure of the exhibit.
We remained convinced, however, that the work that went into developing the story, concepts, and learning goals for the exhibit could be used in the Web site.Ā So, while abandoning the physical framework of the exhibit, we adopted its conceptual framework, structuring the site around physical features of Mars: Volcanoes, Canyons, Landing Sites, etc.Ā Ironically, the summative evaluation of the MarsQuest Exhibit showed that people were largely unaware of this framework: visitors moved to whatever exhibit component caught their eye, without recognizing that they were in a 'Volcanoes' versus a 'Canyons' area.Ā Nevertheless, it is an excellent way to structure the content, both as a governing concept during the design phase, and as a navigational tool on the Web site.
A side benefit of abandoning a more literal treatment of the exhibit is that we were not forced to adapt every component of the exhibit for the Web site. We were free to chose components that worked well on the Web (for instance, Drive a Rover), put aside components that are best as physical interactives (Hot and Cold Globes), and, when inspiration struck, create new on-line interactives that were consistent with the themes and learning goals of the exhibit.Ā
In addition to the exhibit's thematic framework, we also set out to borrow a design philosophy of the science exhibit world.Ā We believed from the start that the Web has many similarities to a museum as an informal learning environment: visitors to each are self-motivated but easily distracted.Ā They have little investment in a given activity, and many alternative activities they could pursue.Ā They may spend very little time with a given component, and as a result learning goals must be achieved quickly.Ā We therefore set out to design a site that contained a variety of focused, short duration pieces that could achieve their learning goals with only one or two minutes of use.Ā
Technology Choice
We had a high technical bar for what we wanted the various site components to accomplish.Ā To meet the project goals the pieces would need to be visually engaging, have various game-like qualities (real time interaction, animation, 3D), handle high resolution imagery and dynamic content, be scaleable, and minimize development time.Ā At the same time, the site needed to be accessible to as many people as possible, minimizing the number of necessary plug-ins, and providing for low-bandwidth solutions through compression and streaming.
At the time we were choosing our approach, several products would have provided us with 3D capability, but all required large (3-5MB) plug-ins.Ā Macromedia Flash would satisfy most of the other requirements, had a small plug-in, and was installed on a large number of machines, but it couldn't provide us with 3D.Ā
In view of these factors, we ultimately decided on a combination of Flash and Director/Shockwave.Ā Flash was used wherever possible because of its small plug-in requirements.Ā When 3D was necessary, Shockwave was used.Ā A significant advantage to this approach was that Shockwave could import and interact with Flash movies.Ā We therefore designed all user interfaces in Flash, and imported them into the Shockwave pieces.Ā This provided a consistent GUI design across the Explore Mars area. It also allowed us to make both the Flash and the Shockwave pieces scaleable: all activities were programmed to open in standalone windows that could be maximized to the user's screen size.Ā This was a particularly important capability given the extensive use of Mars imagery.
Finally, rather than building a single Flash piece that would comprise the entire site, we chose to build a more conventional HTML framework and embed within it standalone interactives.Ā There was a variety of reasons for this, including provision of a more intuitive navigation interface, facilitation of search engine indexing, and flexibility for later modifications and additions.
Overview of the Interactives
Explore Mars, like MarsQuest, is organized into several areas: The Red Planet (an introductory area), Volcanoes, Canyons, Rovers, and Floods.

ĀFigure 4: The Explore Mars home page, showing the different areas.Ā As the buttons are moused over, descriptive text is displayed.Ā This allowed us to provide some explanation without requiring excessive screen real estate. http://www.marsquestonline.org/tour/welcome/
Each area consists primarily of a collection of interactive Flash or Shockwave pieces. There is some text content, as well as a Fast Facts page and some animation, but in general, like the exhibit, the emphasis is on interaction.Ā Some interactives are unique to an area; others are used repeatedly with different data sets.Ā For instance, the Fly in 3D piece uses the same engine to render different parts of Mars in different parts of the site.Ā The use of external data sets to accomplish this not only saves us coding time, but saves the users download time as well.Ā Once a piece has been downloaded it will be locally cached, and if it is run again in a different area, only the new data set will be downloaded.
Below we summarize the interactive pieces: where they are used, and how they connect with the exhibit.Ā Programming and design were done internally at SSI by James Harold, Tyson Brawley, and Evaldas Vidugiris.
Find the Feature: Users are prompted to find features on Mars on Earth (e.g., the tallest volcano) with a globe than they can spin.Ā This is a modified version of a software piece from the exhibit Virtual Planets.Ā Area: 'The Red Planet'.
Fly to Mars: Users are challenged to find the right time to launch a probe from Earth to Mars.Ā There is no equivalent in the exhibit.Ā Area: 'The Red Planet'.
How Big?:Ā Users can drop familiar Earth objects (school buses, Texas) onto Mars images in order to gain a sense of scale.Ā There is no direct equivalent in the exhibit, though many pieces in the exhibit stress scales.Ā Areas: all.
Earth or Mars?: Users are asked to identify whether an image is from Earth or from Mars. The exhibit contains an equivalent piece using large graphics.Ā Area: 'The Red Planet'.
Can you Findģ: Visitors are asked to locate a thumbnail image inside a larger image of Martian terrain. This has conceptual similarities to some exhibit pieces, but no direct equivalent.Ā Areas: all.
Fly in 3D: Visitors can fly over different parts of Mars in 3D. ĀThere is no direct equivalent in the exhibit, although there was a 3D computer model of the Pathfinder landing site.Ā Areas: all.
Drive a Rover: Visitors drive a virtual rover, uploading command sequences one day at a time.Ā This piece was modeled after a drivable rover in the exhibit.Ā Area: 'Rovers'.
Evaluation
From the start, evaluation of the MarsQuest Online effort was a central goal of the project. We weren't simply interested in usability testing and log analysis, but in comparing museums and the Web as informal learning environments. This is non-trivial: building a Web site that gets large numbers of hits is one thing, but determining whether anyone is learning from it is quite another.Ā Nor is it clear whether leveraging from a successful exhibit should produce a successful Web site in the first place.Ā Are content or activities that succeed in an exhibit necessarily successful on the Web?Ā Can a Web site interactive be as engaging as an exhibit, or as effective in helping visitors learn?Ā
This connection between exhibits and the Web was sufficiently important to the project that we hired RK&A, the same group that had worked on the MarsQuest exhibit, as evaluators. It isn't the intent of this paper to go into the evaluation process in any depth: that can be done once the summative is complete.Ā In summary, however, we have to date performed front end and formative evaluations on the project.Ā These helped to identify the expectations of the users (the front end was conducted using visitors to the MarsQuest exhibit: Korn, 2002), and to identify usability concerns in the beta version of the site (Werner, 2003).
The program's summative evaluation will be conducted by RK&A in early 2004.Ā It will include analysis of the Web site logs and usage data (see next section), as well as interviews with site visitors. The interview portion will include site visitors who have seen the MarsQuest Exhibit as well as visitors who have not.Ā In that way we hope to determine how the exhibit and the Web site, together and separately, affect visitor's attitudes and knowledge about Mars and Mars exploration.Ā
Visitor Traffic and Behavior
While summative results were not available in time for this paper, we are able to present some preliminary statistics collected through the Web site.
As this is written, interest in Mars is peaking due to the various Mars missions in operation.Ā This is excellent news for the site, since it brings enormous spikes in traffic (these are being handled by the gracious mirroring efforts of the University Corporation for Atmospheric Research (UCAR) and the San Diego Supercomputer Center (SDSC), to whom we are extremely grateful).Ā However, these kinds of traffic fluctuations make it difficult to analyze the site's success.Ā Not only is the number of visits varying by a factor of more than a hundred, but the behavior of the visitors is changing as well.Ā We can see clear shifts in the popularity of the pieces (not surprisingly, rovers are gaining ground), and increases in the amount of time visitors spend on the site (number of pages viewed and the percentage who run interactives).Ā That suggests that the interest level and/or type of visitor have changed due to the popularity of NASA's rovers. This behavior is best explored at a later date, when this traffic surge has ended, and may require analyzing data from different time periods separately. Nevertheless, the data we have to date are of interest, so we present here some preliminary observations.
Results from Site Logs
The average number of pages per visit (including single page visits) has historically been over 7, so the site is at least engaging enough to encourage visitors to explore.Ā Interestingly, the number of pages per visit has more than doubled (to 15 or more) since the first Mars rover landed.Ā That may suggest that visitors to the site today are more interested in Mars as a result of the rover press coverage, and correspondingly more interested in spending time on the site.Ā
Since the interactive components are central to the site, one measure of success is the percentage of individuals running those interactives.Ā This number is a function of the referring site.Ā For visitors following links from sites such as NASA or the SSI home page (who are presumably most likely to be interested in this site's content), approximately two-thirds run at least one interactive.Ā For referrers such as Google, who will include many accidental visitors, this value drops to 35%.
As was mentioned, content popularity is evolving.Ā Prior to the rover landings, the most popular interactive by a significant margin was the 3D flyover. More recently, the Drive a Rover interactive has been gaining ground.Ā Thematically, the most popular area of Explore Mars is easily Volcanoes.Ā This shouldn't be surprising: volcanoes are familiar objects with exciting connotations.Ā It does suggest that users are making deliberate choices based on the organizational structure of the site.Ā This is supported by results from the formative evaluation in which the evaluators reported that users were clearly reading the descriptions of the areas and making choices accordingly.
Results from Usage Data
While log files can provide information about how users move through HTML pages, they do not by default track movement within Flash and Shockwave. Therefore, as part of the ongoing evaluation, we inserted code into the interactive pieces to record usage information into a database.Ā This typically includes start and stop times, various types of scoring information (how many rocks were found, spacecraft launched, etc.), whether the help button was pressed, and so on.Ā Since the refurbished version of the MarsQuest exhibit includes a kiosk featuring several MarsQuest Online software components, it will provide us with the interesting opportunity of collecting data from both the exhibit and the Web, and compare usage in the two environments.
Analysis of this usage data has not begun in earnest, but we present here some preliminary results from the rover interactive.Ā Historically this was the second most popular piece on the site (behind the 3D flyovers), and it is now tied with the flyovers since the MER rovers went into operation.
In this piece, users command a rover to investigate various rocks.

Figure 5: The Drive a Rover interactive.
ĀUsers prepare sequences of commands for the rover, which will execute one sequence per 'day'.Ā They have eight days to reach as many rocks as they can.Ā The site and rocks are modeled after the Pathfinder/Sojourner mission. When a rock is reached, an image of the real rock, as photographed by Pathfinder, is displayed.
ĀThe piece is modeled after the Sojourner rover, and uses imagery from that mission.Ā As with NASA, an entire day's command sequence (move forwards or backwards, turn left or right) must be planned out in advance, and only one sequence of commands can be sent per 'day'.Ā Users have 8 days to reach as many rocks as possible.Ā The primary learning goal for the piece is a simple one: for users to understand that rovers are not joysticked around the surface like an RC car, but instead given sequences of commands that must then be carried out without further human intervention.
Time in Piece
The chart shows how long in minutes users spent in the Rover piece.

ĀFigure 6: Histogram of time spent using the Rover activity.
ĀThe final bin is neglected in calculating averages, since it likely includes users who left the interactive running after leaving their computer. These times also exclude the initial screen, which doubles as an introduction and loader, so download times are not included.Ā The data give an average usage time of 2:20, with a median of approximately 1:30.Ā Interestingly, this is similar to the usage times for computer interactives in the MarsQuest exhibit at one of its two evaluation sites, which gave a mean time of 2:48 and a median of 1:22 (MarsQuest summative evaluation).Ā Note that there is also a substantial spread in the times, with one-third of visitors spending more than 3 minutes with the piece.
Activity in Piece
There are 5 target rocks in the piece, and the user has 8 days to reach them.ĀĀ Approximately one-third of users reached no rocks; one-third reached only one.Ā No user reached all five. This last result isn't surprising: reaching every rock is quite difficult, and only the concerted efforts of a student programmer convinced us it was possible.Ā However, low scores do not imply lack of interest. Only 15% of the users failed to complete a single day, and over 40% completed all eight days.Ā So, while in one sense no users win', two-thirds of the users demonstrate their ability to navigate by reaching at least one rock, and over one-third of users continue to try until the program stops them.Ā These results are encouraging in two respects: the ability to reach even one rock suggests that we are meeting our primary learning goal, and the persistence of the users suggests that the piece is reasonably engaging.
The Future
At the time of this writing, the Spirit and Opportunity rovers are much in the news, and are having a dramatic influence on the traffic to the site.Ā For a brief time, the public at large will be aware of the latest results in planetary exploration, and many will be taking part vicariously in the exploration of Mars.Ā While the press covers the latest successes and challenges of MER robots, opportunities exist to create lasting changes in the public's understanding of Mars and how we explore it.Ā The success of the MarsQuest Online site in contributing to this understanding will not be known for some time: full evaluation of the site will not be complete until the summative interviews have been conducted, the rover missions have ended, and traffic to the site has stabilized.Ā In the meantime, we will continue making refinements to individual pieces and the site as a whole, responding to formative evaluation results, and adapting our content as Mars Express and the Spirit and Opportunity rovers once again change the way we look at Mars.
References
Association of Science-Technology Centers (2000). 2000 Award for Innovation Goes to Exploratorium Web Team. Consulted January 28, 2004.Ā http://www.astc.org/members/innovation.htm.
Dusenbery, P.B., and L. Mayo (2002).Ā Developing exhibitions through public/private partnerships: A case study of the Space Weather Center exhibit. NASA Office of Space Science Education Conference, Chicago, IL.
Korn, Randi (2002). MarsQuest Summative Evaluation. Consulted January 28, 2004. http://www.informalscience.org/tools/summative.html
Korn, Randi (2002). Front-end Evaluation for MarsQuest Online. Randi Korn and Associates, unpublished.
Werner, Brian, Jill Ross, and Jeff Hayward, Formative Evaluation, Phase 1, MarsQuest Online. People Places & Design Research, unpublished.