Lowell Robinson, David Beck, Pearl Tesler, Exploratorium, and Valerie Knight-Williams, Knight-Williams Research, USA
http://www.exploratorium.edu/evidence/
Abstract
The Exploratorium – a museum of science, art and human perception in San Francisco – is currently in the process of developing a Web-based tool that will help visitors understand and ‘map out’ their own belief systems. This community-based application was created in order to provide visitors with some context in understanding scientific evidence by examining evidence of how they know what they know. But can we map out what we believe? What if our beliefs are factually incorrect? What roles do museums have as arbitrators of truth? My Evidence is an experimental on-line application that challenges visitors to examine what they think they know, and also reminds them that the evaluation of evidence is a fluid process that requires us to continually re-examine our assumptions.
Keywords: on-line community, Web 2.0, creative process, interface design, database, scientific evidence, design process
Introduction
“I believe the earth travels around the sun.”
Today we can say this with collective confidence, but four hundred years ago, Galileo was tried and convicted for this statement. Seeking an audience for his then-radical ideas, Galileo authored a book, Dialogue Concerning the Two Chief World Systems, intended for the public as well as his peers. It reads as a conversation between two philosophers, allowing the reader to be a ‘fly on the wall’ of scientific discourse.
If Galileo were alive today, he’d probably have a blog. What better way to reach the masses? Touted as the great equalizing platform of information, the Web’s multiplicity of voices destabilizes authority. Yet this destabilization cuts both ways. On the Web, we find true alongside false, valid amid invalid, and fact next to fiction, leaving users with the important responsibility of deciding what to believe and what not to believe.
This process of knowledge construction is at the heart of the Exploratorium’s latest project, called Evidence. Funded by a grant from the National Science Foundation, the Evidence project probes the foundations of science in addressing two simple questions: “How do we know what we know?” and “How do we choose what to believe?” The Evidence team is comprised of scientists, educators, content and media developers, researchers from the Exploratorium, and the project’s outside evaluator:
- Rob Semper, Principal Investigator
- Melissa Alexander, Co-Principal Investigator and Project Director
- Thomas Humphrey, Senior Scientist
- Pearl Tesler, Science Writer
- Lowell Robinson, New Media Designer
- Adrian Van Allen, New Media Designer
- Susan Schwartzenberg, Senior Artist
- Mary Miller, Science Writer/Producer
- David Beck, New Media Designer/Programmer
- Liz Spencer, Videographer
- Sherry Hsi, New Media Researcher
- Valerie Knight-Williams, Independent Evaluator
Created for the Evidence project, My Evidence is an on-line application intended to help users better understand their own belief systems and processes of knowledge construction. My Evidence begins by posing a series of statements, such as, “I believe the world is spinning,” and “I believe global warming is caused by humans.” Users choose from among these statements and create their own Evidence Maps, visual tools that help categorize the users’ knowledge according to how it was acquired. As users enter more and more data, patterns in their growing Evidence Maps give insights into what is personally salient to them in their own knowledge construction. My Evidence also allows users to compare their evidence maps to other users’ maps.
From Abstraction To Vision
Addressing Challenges
How do you convey an abstract idea through the medium of the Web? Before work on the Evidence Web site could begin, Project Director Melissa Alexander and her team had to contend with some serious conceptual and practical challenges. Their task was to design a visually engaging, conceptually meaningful way to address the question, “How do we know what we know?” while providing users with authentic science experiences, creating redundancy to reinforce key ideas, developing innovative Web tools and techniques, and offering compelling narratives to explore current science.
Melissa proposed using a charrette to kick off design and development efforts. A charrette is a kind of planning process that incorporates the concerns and ideas of multiple stakeholders. In architecture and urban planning, the stakeholders are typically clients, community members, city officials, and business interests. For our purposes, stakeholders were the project’s actualizers (designers, developers, writers, editors, media makers, evaluators, and producers), content heads (senior scientists and artists, PIs and co-PIs), and audiences (end users, funders, and the museum field).
Initial brainstorming was done in small groups, but prototypes presented at a more intensive two-day design charrette demonstrated the difficulties inherent in expecting the public to think meaningfully about scientific evidence, as opposed to the anecdotal evidence that guides most day-to-day decisions. It soon became apparent that there needed to be multiple paths for various mindsets in order to tackle what scientific evidence was. One of those paths was My Evidence, an interactive way for users to examine their own (largely unconscious) processes of evaluating information.
Checking Expectations and Assumptions
During this early design phase, independent evaluator Valerie Knight-Williams put together three front-end literature reviews to help us get a better sense of how the Evidence site might fit with activities currently on the Web. These three reviews helped us think strategically about the content and context of our project:
The first review informed us about the range of scholars, educators, and researchers currently focused on the public’s understanding of scientific evidence. It uncovered an impressive body of work addressing many of the questions we had been discussing, such as: What is – and isn’t – scientific evidence? How is it gathered? What methods have been used to educate the public about scientific evidence? And finally, what does the public know and understand about scientific evidence? These leads helped ground us in the current work in the field and enabled us to quickly identify and acquire relevant resource materials.
The second review gave us a glimpse of how other Internet projects were currently educating public audiences about scientific evidence. We identified three main themes from 28 projects. First, we found that while most touched on aspects of evidence, they were more broadly concerned with promoting scientific inquiry or conveying the scientific method. Second, we discovered that most of the projects were designed for students in grades 4–12, and were not generally positioned to appeal to adults or the public at large. Finally, we saw little opportunity for people to have in-depth interactions with scientific evidence or a means to analyze or reflect on what scientific evidence means to them personally.
The third review focused on what a visitor to the Web encountered when searching on the topic of scientific evidence. To find out, Valerie’s team conducted four Google searches for terms or phrases involving “evidence” or “scientific evidence,” and then performed a content analysis for each of the first 50 search results. We were surprised to learn, for example, that 32% of these Web sites addressed health issues; 30% focused on scientific evidence in legal contexts; and 22% discussed scientific evidence in the context of evolution and creationism. Only 6% of the sites discussed evidence gathered in current research projects – with the topics in this case ranging from the lost continent of Atlantis, to the use of trap-neuter-return (TNR) among feral cats, to the human-like nature of birds! One Web site (2%) was about paranormal phenomena, presenting “evidence” for the afterlife. Another three (6%) addressed other topics that couldn’t be categorized. Most surprising to us, though, was that only one site (2%) formally defined scientific evidence and then went on to explain the concepts of scientific evidence and provide a framework for understanding the relationship between data and evidence.
Early Ideas of an Interactive Model
Thinking Things Through
As work on the site progressed, we talked about ways to integrate its design with some of the science content themes we had been discussing, such as climate change, mapping human history through DNA, and gravity waves. But an intellectual discussion doesn’t necessarily have to be about something academic; it can be about something personal as well. My Evidence needed to find a way to use the process of questioning in the same way scientists use the process of questioning, but in the context of a user’s everyday experiences. The ultimate decision was to ask people to apply a scientific mindset while examining statements about the world that felt familiar to them.
During this time, Evidence team members were working intensively to think through the issues of creating the overall site. Regular meetings, research, brainstorms, and retreats created an atmosphere of open investigation that would eventually lead media developer Lowell Robinson to begin thinking about why people adopt some ideas, but dismiss others. He began playing with ways to capture the process visually and interactively. With support of team members (and his wife Gradiva), the vision began to solidify, taking the form of an on-line application in which visitors could examine the reasoning behind their own belief systems.
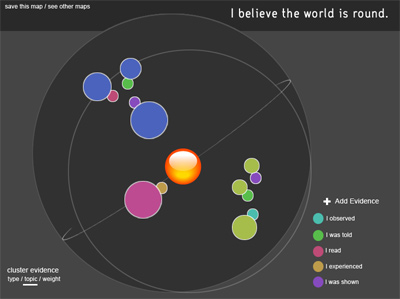
Fig 1: This Photoshop mockup of My Evidence was the first visualization of the project. It preceded the paper version tested on the museum floor.
We began by planning for a design prototype that posed the belief statement, “I believe the world is round.” Users would be asked to think about the statement, and then choose a category with which to respond. The five categories were:
- “I observed...”
- “I was told...”
- “I read...”
- “I experienced...”
- “I was shown...”
When a user clicked on a category, a new screen would come up, and the user could type in something like, “I read... that the world was round in my third-grade science text,” or “I was told... by my grandfather that the world was round.” Each item of evidence created in this way would make a ‘thought bubble in the form of a colored circle on the screen. Each category would have its own color, and each bubble could be sized by the user to represent a more or less important item of evidence. In this way, users would be able to create individual ‘maps’ of how they ‘knew’ about the statement.
This plan would also allow users to cluster the thought bubbles by evidence type, importance, or topic. Why cluster the bubbles? In team meetings, there was a great deal of discussion about the difference between data and evidence. Data provide raw material: you have to filter data to get evidence. Using clustering was designer/developer Lowell Robinson’s way of actualizing this conversation – in essence, mimicking the scientific community’s process of filtering large quantities of data to formulate scientific evidence. The hope was that users entering a large number of ideas into My Evidence could filter them to see something they might not otherwise have seen. For example, if most of your data is in the category ‘I read,’ but the ones you weigh most heavily are in ‘I observed,’ then you might have an interesting understanding of what types of evidence are most important to you. This idea was the basis of making this a tool rather than a scrapbook.
Evaluating the Model
The design team found this prototype interesting, but wondered if others would agree. Before going through the process of building the interactive application, we decided to create a paper mockup for use in evaluation. By using a paper model, we could focus on content rather than usability.
To gather feedback on the prototype, independent evaluator Valerie Knight-Williams conducted in-depth interviews with a small group of Exploratorium visitors. From this process, we hoped to answer a variety of questions:
- Are people interested in and able to generate evidence in response to a statement like, “I believe the world is round”?
- How much are people likely to write in response to such a statement? What other kinds of statements would they like to respond to?
- Do people prefer to write open-ended responses, or would they prefer to click on predetermined choices?
- Do people feel the current response categories capture the kinds of evidence they would likely provide?
- How do people feel about rating their own evidence? How about having other visitors review, rate, and comment on their evidence?
- Are people willing to provide basic personal information to develop a personal profile at the site?
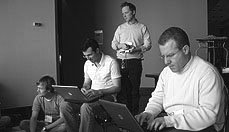
Prototype testing occurred on a weekend day at the Exploratorium. Besides the convenience of working on-site, we chose our museum setting because it drew visitors who represented probable users of the Web site. As Valerie recruited visitors, she sought to find a balanced group of users in terms of age, gender, and science background / knowledge. Visitors who agreed to participate were escorted to a table in a quiet area of the museum, were offered a donut in exchange for their participation, and then responded to a set of questions relating to four draft Web pages.
Responses to the Prototype
Although the visitor group recruited was small, Valerie found that these 12 individuals quickly became engaged in the process of generating and reflecting on their own ideas about evidence. Their feedback on specific features of My Evidence was often consistent, although each visitor also offered a unique perspective on how he or she interacted with and made meaning from the activity as well. We discovered, for instance, that all 12 visitors liked and were able to generate evidence relating to the statement, “I believe the world is round.” Most often they said they:
- were told/taught by an educator or authority figure,
- saw pictures of the world from space,
- looked at a globe/map,
- read it in a text/science book,
- viewed the horizon from an airplane, and/or experienced it in a sailboat.
When asked to estimate the amount they would be willing to write about their evidence, most visitors said they expected to write 2–3 sentences. In actuality, estimates fell short of what they actually offered during the interview (5 sentences on average).
When asked to categorize their own evidence (“What kind of evidence is this?”), visitors had mixed reactions about the appropriateness of the response options, “ I observed, I was told, I read, I experienced, and I was shown”. A few felt that the categories adequately fit the evidence described, while others questioned the basis for the existing options or suggested that the Web team add branches to each category.
Other responses addressed ease of use, preference for clicking versus writing (visitors said they did not mind doing some writing, but wanted clicking to be the predominate experience), and issues of use and privacy (most were comfortable providing limited personal information, and all 12 visitors said they were comfortable having other people review their evidence entries, but only 6 felt willing to have people rate or critique them).
Visitors’ other comments tended to focus on the point or payoff of the activity. Some wanted to be informed about the “real” answer or wanted to see some explanation about why we do know the world is round. Others wanted to see the personal implications of My Evidence addressed in terms of what one should learn from the activity about constructing evidence. Visitors also offered suggestions for My Evidence, including the use of more controversial topics, science topics in the news, and so on.
Revising the Model
After the evaluation, the Evidence team used the reactions and recommendations from Val’s study to guide us in a new round of revisions. We learned a lot.
Most important, people liked it; they enjoyed the process and the challenge. Usability was going to be important: people did not want to have to type too much, but they did want the results to do something interesting. People wanted to know the “right” answer. They wanted to compare their answer to real scientific evidence, and they wanted a payoff ("I want to know how to think more scientifically").
Ultimately, team discussion came around to the larger challenge of choosing the right belief statements. We knew the statements had to really “grab” visitors, but how scientific should they be? Could they be controversial? Lyrical or whimsical? ("I believe love is the answer.") We worried controversial statements would be more likely to provoke negative reactions than invite mental probing. As an exercise, we sat in a group and asked ourselves to analyze three sample statements as they might be used in My Evidence:
- I believe global warming is caused by humans.
- I believe love is a product of evolution.
- I believe the earth is spinning.
For each statement, the group was asked to write up ideas about their own personal evidence. Few people in the group, however, wanted to work on all three statements. And while there were certainly many answers that overlapped, there were many responses that were unique and spoke to the personality of the authors, as well. When Melissa and Lowell got caught up in a debate about personal beliefs, we felt that there might be some value after all in offering an “authority” or some kind of moderation. What would happen when the users on-line looked at each other’s Evidence Maps and saw something they didn’t believe in or agree with? All of these questions were discussed and debated by the group.
In the midst of these conversations and debates, senior scientist Thomas Humphrey became interested in eliciting feedback from a larger group. He sent an e-mail to the entire Exploratorium list-serv – 300 people, many of them scientists – posing the three sample statements and seeking responses in the five answer formats (“I observed...,” “I was told...,” etc.). Everyone on the team received a variety of responses. One stand-out response came from Exploratorium staff biologist Charles Carlson, who compiled a long and varied list of possible answers.
Fig 2: When the Evidence team asked for My Evidence test responses from Exploratorium staff, Life Sciences Director Charles Carlson created this sample list of belief statements. Staff responses like this one helped us identify some of the project’s design and language issues.
This, the first unmoderated test of the idea, was fun and interesting for the Evidence team. It was encouraging that the tool might actually be cool – the list on its own was cool, and if you could add additional tools, it would be even more cool. The list also provided some insights into needed improvements: After seeing Charlie’s responses, for instance, the team realized that they needed to refine the words used in the belief statements. Other issues had to be addressed, as well.
Refining the Design
At this point, Lowell began meeting with developer/programmer David Beck, and together they brainstormed many of the finer points of the design. New on staff, David had not been part of the development team up to this time, and brought a fresh perspective to the project, as well as programming and design expertise.
In several sessions, Lowell and David reworked a prototype model, incorporating features that better matched what came out of the evaluation and group discussions. The original prototype was kept as a paper, non-interactive mockup to preserve its flexibility and allow input from non-technical team members. As the prototype migrated from paper to interactive mockup, however, it locked down programming and design decisions and made it more difficult for non-interactive developers to participate in its creation.
In conversation and on paper, Lowell and David explored a wide range of design questions addressing everything from privacy and authority to the visual design. Each of these issues needed careful consideration:
Usability
- How can we engage the visitor? What can we do to allow users some immediate gratification?
- Will registration be required or can it be kept simple so users can explore without going through an arduous process?
- What about privacy issues? How can we create a private, safe space that will allow people to explore ideas, things they might not feel totally confident about? At what point can you invite them to share that?
- What information would we need from users that could help us build a database of responses to be shared? Age, gender, scientist/non-scientist, etc.?
- A lot of 2.0 applications are big on the idea of sharing, but only allow sharing on a very superficial level. How can we design in a way that offers tools that address the needs of intellectual complexity?
- How can we figure out whether people will want to browse each others’ Evidence Maps – by popularity, by maps that are most like or unlike mine, by scientists, by women?
Moderation and Authority
- Should the Exploratorium moderate, edit, or censor Evidence Maps?
- How do we deal with the possibility of users putting incorrect (and uncorrected) scientific information on their Evidence Maps, which then becomes part of the Exploratorium’s site?
- How do we create a system that allows people to look at and comment on each other’s evidence without igniting a flame war or jeopardizing each individual’s safe space for exploration?
Interactive Design Considerations
- How can we address the evaluation finding that people wanted something more than just to look at a list of information? If we use more advanced ways of filtering or comparing data, are there more interesting findings that users might be able to see?
- How can our design be functional both for people who don’t want to write very much, as well as for people who want to have a more freeform entry?
- How can we allow people to get their ideas out quickly if they don’t want to go through all the steps of creating a Map.
- Based on the evaluation, people wanted a “deep thought” to come out of the experience. Would it make sense to ask people to add a note or comment, at the end of the process, or are we demanding too much from the user?
- Some people in the evaluation asked for a chronological aspect of the Evidence Map. Was there a way to do this?
Working Through the Words
Once Lowell and David had hashed out these issues, they met with science writer Pearl Tesler to refine some of the nomenclature for the tool. Working as a three-person team, Lowell, David, and Pearl revisited the idea of changing the wording of the response categories, known to be a problem. Our advisors had also noted semantic issues we knew we needed to deal with. Geneticist Svante Pääbo, for example, was uncomfortable with the word “believe” because he separated the meaning of “to think” from “to believe,” in that you can “think” one thing today, and something else tomorrow; for him, “belief” felt too rigid and permanent.
In response, Pearl, David, and Lowell changed the five original categories: (I observed...I was told...I read...I experienced...I was shown...) to a list of four more complex possibilities that included sub-categories. These revised categories did a better job of identifying primary and secondary experiences:
- I noticed...(implies primary experience and takes the place of I observed)
- I viewed...(implies passivity: TVs, movies)
- I was told...(teacher, parent, friend, peer, stranger)
- I read...(text book, science journal, popular magazine, newspaper, Web site)
Because David Beck and Lowell Robinson each have skills in both programming and art, the interactive development process did not follow the traditional pattern of a designer giving an Illustrator file to a Flash developer, and then the Flash developer doing all the programming individually. Rather, Lowell and David worked in parallel. David did the majority of the technical design, and Lowell did the majority of the visual design, but each was able to alter and finesse the other’s work. The master files were shared on an Exploratorium server for ease of access.
David, who has expertise in database and community building, began the process by developing a map for the data tables that would exist, and figuring out how they would be interrelated. He also sketched out a code architecture – a programming plan would serve as a working guide – especially important since more than one developer was working on the tool.

Fig 3. The My Evidence code architecture describes the hierarchy of the object-oriented programming
The application consists of a Flash front-end supported by server-side MySQL and PHP, with XML being the primary data-transfer medium. The Flash was developed in nested, modular pieces which assemble at run-time, thereby enabling simultaneous work by multiple developers on different areas of My Evidence.
Accessibility
We felt it was important to make My Evidence as accessible as possible to our visitors. In addition to streamlining the usability of the Evidence Maps, we focused on two functions that would open the tool to a broader audience and make saving and revisiting maps less difficult.
First, the Flash application is built to be language-independent. All language elements (button labels, pull-down menus, etc.) are stored in a database and indexed to a languages table, which then populates the My Evidence application when the user specifies his or her desired language. Adding a new language becomes a (somewhat) simple matter of adding new text via an on-line table of function labels cross-referenced to languages.
Second, although Evidence Maps may be created without logging in, we do require a user log-in for saving and publishing maps. In this initial build-out, we streamlined this process for people within the established Exploratorium community by repurposing an existing user-authentication system.
Fig 4: The data scheme for My Evidence describes the structure of the MySQL database and defines relationships between collections of data.
Building the First Interactive Version of My Evidence
Working in Tandem
At this point, the concept of My Evidence was solid, but depending on the design of the Evidence Web site, there were still many possibilities for how it could be deployed (download, popup window, internal to the site). Since these decisions would affect the visual design of the tool and how much screen space it was allowed, Lowell and David needed at least a rough idea of the overall site design. While this might have proved awkward or created a time crunch if a different team had been handling the site’s design, in this case Lowell was able to do the initial design pass on the Evidence site and get preliminary approval. This was enough to provide a working space for the My Evidence project to proceed.
David built the first interactive version of My Evidence using placeholder art. When this version was partially functioning, with some interactivity in place, Lowell then worked on the tool’s visual design, incorporating knowledge about how it would be integrated into the overall site, what screen real estate would be available, and so on. Because both were skilled in design and programming, questions of capability rarely came up. Instead, the challenge was capacity: Lowell and David needed to be careful about setting realistic goals so that an end product could be created.
Competing Interests
We wanted the site to be fun and easy to understand, to foster self-discovery and a better understanding of commonalities or differences of experience, and to feel safe. Yet working toward one goal often negatively impacted another. Would creating a visually appealing element detract from the meaning conveyed by the relationships between pieces of evidence? Would requiring personal information raise fears of loss of privacy or of opening oneself to the judgment of others? The more complex the data, the deeper the meaning conveyed by the system – and yet we wanted the initial learning curve to be very shallow.
The design process became one of balancing goals for the site. The site needed to ‘pop’; it required that ‘cool’ factor that gets attention on the increasingly dynamic Internet – yet we didn't want dynamism purely for dynamism's sake. Movement, color, and sheen had to contribute to the meaningfulness of the tool, without complicating users’ experience.
We needed to create an interface that would be understood quickly by users without limiting the possibility of deeper inquiries into an individual’s own learning process. But we also wanted the users to experience an “aha” moment after entering only a few pieces of evidence. As a result, the visual design had to create obvious relationships between the bits of evidence.
A fully developed map would be a complex matrix of narratives cross-indexed by time and place. We needed to supply visualization tools to allow the users to glean subtler meanings from the data, while also being able to compare their maps to the maps of others in meaningful ways.
It was imperative that the users know they could use the system in complete anonymity and security. We didn't want anyone to feel bad after creating a map – that wasn't the point of the exercise. Nor did we want people to fear judgment from others if they decided to publish their maps.
Ultimately, the success of My Evidence will depend on how adeptly we've integrated these various interests into a simple yet deeply rewarding space.
Next Steps
As of this writing, in early 2007, we are looking forward to the final stages of interactive development for My Evidence. To be fully effective, the tool will need to handle not only the needs of individual users, but also a host of more complex interactions. By incorporating intelligent search functions, we’re planning to offer the ability not only to store and search through each individual’s data, but also to share, rate, and compare one another’s data. At this point, a new round of evaluation – this time a more extensive on-line survey – will help guide our work, providing feedback from a broader group of adults fitting target audience criteria from diverse regions of the country.
When the tool’s design is final, we’ll have one more major development task before offering My Evidence to the public, and that is to make sure the system doesn’t start out empty. The team has always wanted to seed My Evidence with Evidence Maps offered by working scientists. Besides being of interest in and of themselves, these maps will provide thoughtful models and baselines for user comparisons, setting a tone of quality and professionalism that will help ensure (as much as possible within the environment of the Internet) that the tool is used safely and appropriately. As part of the larger Evidence project, this initial content will also enrich the audience’s understanding of some of the scientists profiled elsewhere on the site, and give users the opportunity to identify on a personal basis with working scientists. If all goes well, users of My Evidence will ultimately have rich personal experiences that will help them think critically about their own – as well as others’ – patterns of thinking and learning.
Acknowledgments
At the Exploratorium, no one works alone. But in particular, I would like to thank Ruth Brown, who is one hell of an editor. And I would also like to thank my wife, Gradiva, who is evidence of love, support, and beauty; I love you deeply. – Lowell Robinson
This material is based upon work supported by the National Science Foundation under Grant No. 0452128.
Cite as:
Robinson,
L., et al., My Evidence: Who’s the Authority Here? ,
in J. Trant and D. Bearman (eds.). Museums and the Web 2007: Proceedings,
Toronto: Archives & Museum Informatics, published March 1, 2007 Consulted
http://www.archimuse.com/mw2007/papers/robinson/robinson.html
Note: Acknowledgements updated at authors' request.
Editorial Note