
![]()
![]()
![]()
![]()
![]()
![]()
![]()
![]()
![]()
![]()
![]()
![]()
![]()
Archives & Museum Informatics
158 Lee Avenue
Toronto, Ontario
M4E 2P3 Canada
info @ archimuse.com
www.archimuse.com
| |
Search A&MI |
Join
our
Mailing List.
Privacy.
published: April, 2002
� Archives & Museum Informatics, 2002.
![]()

Statistics, Structures & Satisfied Customers: Using web log data to improve site performance
Darren Peacock, National Museum of Australia, Australia
Abstract
Qualitative and quantitative evaluation of visitor experience in museums has a proud and well established tradition. Long before “customer relationship management” became a ubiquitous catch cry, museums were engaged in rigorous and sophisticated analyses of their audiences. Similarly, museums have also been at the forefront of developments in online content delivery. Yet, the culture of rigorous evaluation applied to traditional visitor research is not nearly so apparent in the online museum environment.
As competition amongst online content providers becomes more intense, museums need to embrace a more rigorous approach to understanding and developing their web audiences. Building on our established traditions of audience evaluation, museums can once again lead the way in developing understandings of how visitors explore and engage with content in the new realm of virtual experience.
Web log analysis is an under-utilised approach to understanding and testing visitor behaviour on the web. Every visit to a site leaves a potentially rich vein of information for any willing data miner. Utilising that data effectively to understand the visitor’s experience is essential to building web sites that work.
The National Museum of Australia is using the analysis of web log data to inform the redesign of its online presence. Using new analysis tools, historical log data is being mined to test hypotheses about user behaviour and to develop new approaches to site structure and design. As the new site is implemented web log data will be used as the basis for the ongoing study of changing patterns of visitor behavior.
Keywords: evaluation, log, museum, statistics, web
Introduction
Why should we evaluate websites? Like any museum endeavour, if we start out without a map of what we hope to achieve, it is likely we’ll end up some place quite different. Evaluation helps us find our bearings and to move on to the next stage.
Another answer to the question ‘why evaluate’ is that, unless we do, future developments will rely on guesswork rather than research. In the online world, it is all too easy to let the technology drive the agenda. Evaluation pulls us back to the world of the user and commits us to an active engagement with our online visitors and their needs, expectations and experiences.
By now, most museums are through the establishment phase of their online evolution. The challenge now is to establish a sustainable program of continuous improvement in online content, based on what we know about the medium and our visitors’ use of it. Museums are well versed in the tools and techniques of evaluation. In the past four decades, visitor studies have fundamentally altered approaches to the development and delivery of core museum services. As Hein (1998) observes, “interest in visitor studies expanded dramatically in the 1960’s, coincident with both increased government spending on a wide range of social services and increased application of social science research to examine these activities.”
Exhibitions, activity and education programs and the publics who use them have benefited enormously from the application of rigorous techniques of critical evaluation. As museum spending for online service delivery increases, the need for audience research also grows, both to justify further investment and to substantiate returns on current investments.
Online content delivery is here to stay as a core function of museums. What then will we use as our guide in developing online material and creating and extending our audiences? What kind of evaluation tools can we use? Which will yield the best results in terms of improving the user experience? How can we establish a cycle of continuous improvement as online audiences grow and their expectations increase? These are the questions this paper addresses.
Museums were quick to seize the opportunities offered by the web. Now, just having a site is no longer sufficient. Having a site that demonstrably meets and develops user expectations is essential. As the number of surfing options grows exponentially, museum sites have to compete for the eyes and mouse clicks of users in an increasingly cluttered and competitive cyberspace.
Any evaluation approach requires both data and a methodology, or framework of analysis. This paper explores some of the ways in which the National Museum of Australia is using web analysis tools to shape its future directions in the delivery of online services.
In particular, it explores the potential of quantitative analysis, based on web server log data, to convert these ephemeral traces of user experience into a strategic management approach for online service delivery. My goal is to present a methodology and a set of potential e-metrics for evaluating and improving user experience on museum websites. In this model, customer satisfaction, measured through quantitative analysis, provides benchmarks for site performance and directions for future development.
National Museum of Australia
The National Museum of Australia is in the unusual position of having established an online presence before it became a physical reality. The museum has operated online since 1995 (www.nma.gov.au). However, it was only a year ago that the museum opened its major visiting facility on the shores of Lake Burley Griffin in Canberra, the nation’s capital.
The museum building was a flagship project celebrating the Centenary of Federation, when, in 1901, six British colonies united to form the nation of Australia. The National Museum of Australia benefits from having being born digital. It is a truly wired museum and incorporates a full television and radio broadcasting facility, which has already been harnessed for producing webcast content.
From the very beginning, it was understood that virtual audiences- both broadcast and on line- would be integral to the National Museum’s operations. Canberra is a city of just 300 000 people, relatively distant from the main population centres of Sydney and Melbourne. To serve the whole of the nation, the National Museum has a major commitment to using technology to reach diverse and remote audiences. Moreover, as an institution, we are positioned as a forum, not a temple- to use the terms of Duncan Cameron’s 1971 thesis- committed to stimulating, convening and contributing to national debate. Broadcasts, webcasts and other electronic outreach are vital to our mission and reason for being. Building our online presence is a key strategic priority.
New medium, new audiences?
When we look for models of website evaluation, we can turn to the museum world’s own rich repertoire of visitor research tools and techniques and also to the market research paradigms of commercial online services. Our choice of method raises the question of how online museum audiences differ from physical museum visitors. Do they have more in common with gamers and e-shoppers? Are their expectations of online museums shaped by their experience of traditional museums or by their experiences in the online world? What models and benchmarks of customer service can we or should we embrace from non-museum sites?
This takes us into the territory- well trodden by visitor studies research- of who do or should museums serve? In the online environment, this becomes a question of who are our audiences (users), how do we attract them and how do we serve them? What models of customer service do we wish to establish for online museum services? How will we know if we are meeting users’ needs? And just what are their needs?
Despite the established tradition of evaluation research within museums, models of museum website evaluation have been slow to emerge. Studies of individual sites or comparative analyses have shed some light on user expectations and experiences. A number of papers previously presented at this forum-Bowen (1997), Chadwick and Boverie (1999) and Semper and Jackson (2000)- provide much food for thought.
The results from these studies may answer specific questions about particular site content and design, but are yet to establish a generalised hypothesis about the nature of user experience on museum sites. Teather (1998) observed that ‘user study is seldom taken up as it is seen as too expensive….’
Perhaps rather than cost, the problem lies in deciding what to test about user experience. Certainly there have been extensive efforts in the area of useability testing, where functions, navigation and graphic design can be tested by potential users. But usability testing is not the same as usefulness testing. Without an understanding of user needs and expectations, a site may be well designed without being useful.
Not surprisingly, much research attention to date has been focussed on the sites themselves, rather than directly on audiences. As web technologies have rapidly evolved, there has been much experimentation with the form and content of museum sites.
Many sites have evolved from the first generation brochureware sort, to become multi-dimensional interactive spaces, including databases and complex multimedia presentations. An initial focus on the potential of technology has been a necessary starting point, but organisational goals are now developing beyond just having a site to having an online presence which is driven by the strategic mission and goals of the organisation, not just the latest technological innovations.
To ensure that our online offerings are relevant and useful, we must proceed from an audience (user) perspective. Our analysis of online services should encompass the whole visit experience, from its genesis to its conclusion, taking customer satisfaction as its goal. This approach has already been advocated effectively by Falk and Dierking (1992, 2000) in their research methodologies for museum visitor studies.
Obviously, any visitor research has to compete for funding and attention against other more pressing operational needs, including traditional forms of visitor research. Yet web evaluation is in fact potentially cheaper than other traditional forms of observational and survey research. Moreover, research into web audiences can extend and enrich our understandings of visitors who do come through the door.
Research choices
Research into visitor experience comes in many forms, typically dividing into qualitative and quantitative methods. Hein (1998) has offered a useful summary of popular techniques.
Front-end usability research techniques have used a range of methods for assessing the interaction between people and computer interfaces. Usability research for human-computer interaction has a long history. People like Jakob Neilsen have made a major contribution to our understanding of these interactions.
Yet, as Teather (1998) observed, usability testing approaches need to be more closely aligned to models of museum visitor research. Usability testing may tend to centre too much on engineering and technical design, focusing on the site or interface itself, rather than putting the visitor at the centre of the analysis.
To get to the heart of usability, we need to understand users’ needs and motivations, not just their responses. We need to model those needs and to design and test accordingly, not just for functional effectiveness and efficiency, but for customer satisfaction.
This is where commercial market research approaches can help us with the task of differentiating our users and their needs. Techniques of audience segmentation and the personalisation of content begin to recognise the diversity of users and user needs, rather than focussing on the site itself. Recent publications by Inan (2002), Sterne (2001), and Grossnickle and Raskin (2001) provide excellent overviews and critiques of research and evaluation methods being developed in the commercial online world.
Let the servers do the surveying
But what data shall we use for our analysis? Log file data, quietly accumulating on web servers, is the cheapest and least exploited data source for understanding museum web visitors and their needs. No other survey technique generates as much data for so little effort. The trick is to turn it into useful information and practical applications.
Unfortunately, due to an emphasis on its deficiencies, log data has a rather poor reputation. I would like to demonstrate how, for me, it sits at the foundation of our approach.
Log data has been dismissed as useless and inaccurate because of some inbuilt limitations which arise from the way the web works. After initial early enthusiasm for web log analysis, in recent years, commentators have tended to pay lip service to the data and move on to suggest other alternatives. Analysis of museum web sites has typically focussed on other qualitative forms of analysis gathered through surveys of users or by observational analysis.
I will recap briefly the nature and limitations of log data for those who are unfamiliar with or have been deterred from further exploration. I would then like to examine how, notwithstanding those limitations, log data may be used as the basis for a methodology to test visitor satisfaction with their online experiences.
Getting beyond the traffic
Web logs were initially used as traffic counters. Fundamentally, they are a tool of the technicians. They were originally set up to measure the volume of page requests, which provided important information to help plan server capacity. The widespread, erroneous use of ‘hits’ as a measure of site effectiveness contributed significantly to the discrediting of log based research.
The exploration of log data as a potential source of market intelligence by some coincided with the discovery of its deficiencies as a measurement tool by others. Because of the way the web operates, in particular the process of caching, logs do not reliably count the total number of page requests or user sessions. However, this does not, as some have suggested, render log file data as “worse than useless”. With caution and appropriate caveats, log data is still a rich and useful source of relevant information about the user experience.
If we move beyond simply tracking site traffic, we can reconceptualise log data as a survey sample of web visitors. It is not the whole story, but a significant and valuable sample of the whole.
Like all sampling techniques, log data has inherent biases and blind spots. As any visitor researcher will attest, the perfect sample of any visitor population is hard to find. Yet if we acknowledge the deficiencies of the log derived sample of web visitors, we can possibly turn them to advantage.
The biases of log data are at least constant and predictable. Because of caching it consistently underreports repeat visitors and users from the most popular ISPs. Log files may also inflate the number of unique visitors to a site, as the same user may be logged with multiple IP addresses during a single session.
These skews in the data suggest that the sample users recorded in the logs are more likely to be first time visitors to the site. In a study of customer satisfaction it is these users who are probably of more interest than repeat visitors. Arguably, we may consider that repeat visitors were at least partly satisfied during their previous visits to motivate a return.
Log derived data about user behaviour may therefore be most revealing in ascertaining how new visitors access and make use of the site and whether they leave satisfied by the experience. The data recorded in the logs about these users can provide useful insights into the initial impressions and motivations of first time visitors to our site. After all, in an increasingly competitive cyberspace, new visitors are the main hope for growing online museum audiences.
The advantages of log files are that they produce quantitative data that can be subjected to statistical analysis. The data samples are large and can be tracked over time. The data produced is a record of actual user behaviour rather than reported or assumed activity. Log data is recorded free of observer or questioner bias.
If we accept that, despite its inadequacies, log data is the most comprehensive source of data about online visitor behaviour, how do we build a model to apply that data to the measurement of site effectiveness, that is, of customer satisfaction?
Modeling the user experience
In modeling the user experience, we should return to the concept of visitor needs. Like visitors to museums generally, web visitors are not empty vessels waiting to be filled with museum content. Falk and Dierking (1992) have elsewhere made the case for acknowledging ‘visitor agendas’ amongst physical museum visitors. In the online realm as well, visitors often have clear, conscious agendas of their own and sophisticated searching skills to pursue their goals. If those agendas are not satisfied, visitors are soon lost and may never return.
Psychologist Abraham Maslow offered one of the simplest and most compelling frameworks for understanding human motivation with his Hierarchy of Human Needs (1954). Adapting the idea of Maslow’s hierarchy to the needs of online museum visitors, I would like to suggest a framework for testing user experience based on analysis of web log data.

Figure 1. Hierarchy of web user needs
(detailed image)
The four tiers of the proposed framework (Figure 1) map the stages by which users access and explore a site. At each level there are a set of log diagnostics which can be used to measure the pathways and obstacles to user satisfaction. Together, these diagnostics form a set of e-metrics which can be applied across institutions and across time to benchmark site effectiveness.
Level 1: Can I find it?
At the lowest level of the hierarchy, we are concerned with the most fundamental issue- how the visitor gets to the site. Log data enables us to monitor and examine the ways in which site traffic is generated.
This is a fundamental diagnostic, showing the effectiveness of search engine registrations, links from other sites and our own site promotions. For example, on our site, eight of the top ten external referrers in the month of January 2002 were popular search engines. The other two were links established by the museum with other organisations as cross-promotions, one a local tourism centre, the other a scientific research institution.
This level also shows the context of the visit. Most users will visit several sites in a single internet session. There may be a logical sequence from one search or site to another. Analysis of the search criteria used to locate the site will show what search terms visitors are using to find the site.
From the first level of the analysis framework, we can establish a picture of our place on the information superhighway and the routes traversed to locate our sites. Comparison between sites enables us to establish a sense of where and how the site’s profile can be enhanced.
Some of the key questions addressed at this level include:
- How many people come directly to the site home page?
- What proportion arrive through search engines?
- What proportion arrive at other parts of the site?
At the National Museum of Australia, we discovered from log data that many visitors were coming to the site to plan a trip to the new museum. Information about daily events at the museum was an obvious goal for a high number of visitors to the site. To make it easier to achieve the goal we created a “What’s On Today” link in a prominent position on the home page. The log data shows a clear response to this innovation. In the week we introduced the link, some 200 visitors clicked there first. After a month, it had become the second most popular link from the front page.
Level Two: Does it work?
The second level of the needs hierarchy examines the user experience from the practical perspective of site performance. A museum perspective on site performance might encompass issues about availability and the management of traffic volumes. From the user point of view, the key issues are speed and reliability.
The goal of performance standards for this level in the hierarchy relate to the fast and effective delivery of pages to the broadest range of potential users, regardless of their operating systems and network connections. Log data provides effective monitoring of the content delivery experience of users. Error logs show such defects as broken links, server errors and refused requests.
Unfilled requests showing aborted page requests provide evidence of user frustration with slow downloads. Recurring patterns of unfilled requests point to problems with design and file sizing. Fortunately, I can report that >98% of the page requests for our site in January 2002 were delivered successfully (Status code 200).
Users come in all shapes and sizes. They arrive at our sites using a bewildering array of hardware and software. Profiles derived from log files of the browser and operating software deployed by our users sheds light on visitors’ needs and helps establish minimum and maximum standards.
For example if you discover- as we did- that 60% of your visitors are using Internet Explorer v5 and above to access the site, this may be the median (or the baseline) for which you design. You can also accurately identify the extent to which you risk disenfranchising potential users by pitching your site design beyond the capability of their software or network connections. These measures can also be compared to industry standards to assess the visitor population of the site against the whole population of internet users.
For the month of January 2002, the distribution of browsers employed by visitors to the National Museum site were as follows:

Figure 2. Breakdown of visitors by browser type and version, National
Museum of Australia website, January 2002
Level 3: Does it have what I’m looking for?
The third level in the hierarchy moves from the operational accessibility of the site to the effectiveness of the content and its organisation.
This level is concerned with navigation and how it facilitates or impedes the user experience. Log data in respect of this area requires more complex interpretive approaches. The data can be used to test hypotheses about the search goals and strategies of visitors to highlight potential areas for improvement.
At a more fundamental level, pathing analysis helps us to understand the motivations of visitors. If we analyse where they enter a site, how they move through it and where they exit, we can test hypotheses about their motivations and goals.
This type of material proves most potent in understanding how visitors interact with your site. It also serves to remind us that many visitors merely pass through our sites on their way from and to somewhere else. The trick is to hold their attention. If we fail to capture their interest beyond the click that brought them to our sites, there is something seriously wrong. The analogy is the physical visitor who enters the building and departs without looking further. Certainly, this counts as a visit, but we can hardly consider it a satisfied customer.
Our first exploration of pathway analysis was revealing and sobering. Our web analysis tool- Webhound – from the SAS Institute, generates a top ten pathway report for any given period. This report has shown a potential problem with a very high level of attrition from the home page, which we are hoping to address with a redesign.
The January report- before the redesign- shows the following as the most popular ‘triplet’ combinations (sequence of three pages) on the museum site:
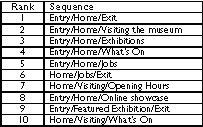
Figure 3.�Most popular three page sequences in rank order, National Museum
of Australia website, January 2002.
Webhound also maps the sequences dynamically so you can assess the popularity or otherwise of any particular pathway through the site. This is also an excellent way to track the level of penetration into the site and the extent of decay with each click point.
Level four: Does it satisfy my needs?
Atop the pyramid is the holy grail of customer satisfaction. How do we know that we’ve met the needs of visitors? Few, if any, give us direct feedback; repeat visitation is another form of vindication- if it can be tracked; ad hoc surveys may establish some measure of satisfaction.
Once again it is log data that provides the largest, most objective and most valuable record of user experience. That is, if we know how to interpret it. This model of user needs proceeds from the assumption that visitors to museum sites are goal directed. Whether they are browsers or searchers, once they have clicked into the site, they are demonstrating a need or an interest which they believe, rightly or wrongly, that the site can fulfil.
How they pursue that need or interest and the extent to which it is fulfilled, can only be accurately tracked by reference to the logs. A number of diagnostics can be devised to measure satisfaction in the sense of a goal that has been achieved. I suggest four as the basis for testing hypotheses. Two of these relate to the last thing that a visitor does before leaving a site. For example, the last page visited is revealing. For the month of January, 2002, on the National Museum of Australia site, they were as follows:

Figure 4. Last page visited in rank order, National Museum of Australia
website, January 2002
Once again, it suggests that our visitors have clear goals for their visits. Correlation of the exit page with the original referrer or search terms can be used to confirm the intentionality of the visitor and to assess if their goals appear to have been achieved, eg. to find a job, a tender, or ‘what’s on’ information.
A set of log-based diagnostics
From this framework therefore, I would like to propose 20 log based diagnostics for evaluating the performance of museum sites (Figure 5). The first five, which are traditional ‘traffic’ indicators, showing the volume and origin of page requests: sessions, page views, duration, domain, time of visit.

Figure 5. 20 log based metrics for evaluating museum websites
The second group of ‘satisfaction’ indicators relate to the four levels of the user needs hierarchy outlined in Figure 1. As the National Museum of Australia extends its online presence, these are the metrics we will use to track performance and to inform design and content development decisions. Imperfect science perhaps, but an improvement on the guesswork of the past.
Conclusion
Museums have long been adept at analysing their customers through rigorous and diverse analysis of visitor needs and behaviour. The internet offers museums vast new ways of reaching and engaging with audiences, both existing and those who have never visited before. We have to learn how to apply new tools of analysis with the same rigour and spirit of open enquiry that has characterised the last forty years of museum visitor research.
With our already established practices of research, we should be able to emulate the best practice evaluation models emerging in the commercial online world.
This paper has suggested a possible starting point for building an evaluation model for online museum services. Web log data, despite its limitations, is an essential part of that framework. It can be supplemented by other research, but it offers unique advantages as a source of data on the user experience.
The implementation of such frameworks will ensure that our online offerings are dynamic in response to customer needs, not just technological innovation. In an increasingly competitive cyberspace, building and nurturing customer relationships will be essential. We’ve only just begun this new voyage of audience discovery. I hope the map offered here helps.
Acknowledgements
Special thanks to the SAS Institute Inc. for their ongoing support of the National Museum of Australia.
References
Bowen, J. (1997) The Virtual Library museums page (VLmp): Whence and Whither? In D. Bearman and J. Trant (Eds.) Museums and the Web 97: Selected Papers. Pittsburgh: Archives and Museum Informatics. 9-25
Cameron, D. (1971) “Museums, Temple or Forum”, Curator 14 (1).
Chadwick, J. & Boverie, P. (1999) A Survey of Characteristics and Patterns of Behaviour in Visitors to a Museum Web Site. In D. Bearman and J. Trant (Eds.) Museums and the Web 1999, Selected papers from an International Conference. Pittsburgh: Archives and Museum Informatics. 163-172
Falk, J.H., Dierking, L.D. (1992) The Museum Experience. Washington DC: Whalesback Books.
Falk, J.H., Dierking, L.D. (2000) Learning from Museums. Walnut Creek, CA, Alta Mira Press.
Grossnickle, J. & Raskin, O. (2001) The Handbook of Online Marketing Research: Knowing Your Customer Using the Net. New York: McGraw Hill.
Harms, I. &, Schweibenz, W. (2001) Evaluating the Usability of a Museum Web Site. In D. Bearman and J. Trant (Eds.) Museums and the Web 2001, Selected papers from an International Conference. Pittsburgh: Archives and Museum Informatics Museums and the Web 2001 43-52
Hein, G.E., (1998) Learning in the Museum. London: Routledge.
Inan, H. (2002) Measuring the success of your website: A customer-centric approach to website management. Sydney: Pearson Education Australia.
Maslow, A. (1954) Motivation and Personality. 3rd edition 1987, New York: Harper and Row.
Semper, R. & Jackson, R. (2000) Who’s Out There. In D. Bearman and J. Trant (Eds.) Museums and the Web 2000, Selected papers from an International Conference. Pittsburgh: Archives and Museum Informatics. 179-197
Sterne, J. (2001). World Wide Web Marketing: Integrating the Web into your Marketing Strategy., 3rd edition, New York: Wiley.
Teather, L. (1998) A museum is a museum is a museum or is it: Exploring museology and the web. Museums and the Web 98 papers Pittsburgh: Archives and Museum Informatics. http://www.archimuse.com/mw98/papers/teather/teather_paper.html