This paper is dedicated to the memory of Heinz Leitner, who died October 8, 2007.
Overview
Access to information enables sharing knowledge among people, therefore nowadays it is becoming more and more important. A problematic aspect lies in the fact that several types of information exist: textual, photographic, spatial etc... The geographical referencing introduces additional complexity, but it allows a common and uniform access to data.
An increasing number of applications requires more advanced tools to represent and analyse the 3D world (Schmidt, 2002). Among all the possible types of systems dealing with spatial information, GIS has proven to be a very sophisticated system that operates with a large volume of spatial and semantic relationships and provides means to analyse them, but is still very much oriented towards 2D data. In Cultural Heritage it is often required to use geo-referenced information, therefore 2D GIS techniques are being increasingly used. However, currently no method is fully able to cope with the complex needs of Cultural Assets (Remodino & El-Hakim, 2005). Thus new ways to represent and query data, especially to give a high level overview, are still desiderable and worth being developed.
Recent developments have opened new horizons for 3D visualization and computer technologies are capable to handle, process and display a great deal of information of various kind, but the interaction with 3D data is still an open issue (Bowman, Kruijff, LaViola & Poupyrev, 2004). So far a large amount of knowledge exists dealing with the design of 2D interfaces in the field of human-computer interaction (HCI), but these guidelines may be not specifically apply to 3D interfaces and 3D environments rendered in real-time. Several approaches exist: games like First Person Shooters have made more common the interaction with 3D models, but in these games it is normally not needed to convey very complex information. Thus there is no common accepted spontaneous way to convey Cultural Heritage information to professional and interested people working in the field.
Although it is possible to assert that in many cases a 3D representation is the best way to represent spatial information in a coherent way, this introduces an additional degree of complexity as the display and input mechanisms of normal computers are limited to 2D. Nowadays we are witnessing a rapid development in Web-mapping and geoinformation through Internet. 3D geoinformation systems, like Web-based 3D geovisualisation (Zlatanova, Rahman & Pilouk, 2002) and 3D geoinformation technologies (Ryan,Cinotti & Raffa, 2005), have received considerable attention over the last few years. Many projects have the capacity to improve the exploitation of existing geospatial content within 3D geoinformation services, but they do not address the aspects of capturing, updating and sharing such contents within a 3D environment.
For sure Internet, and in particular search engines like Google, have revolutioned the way to handle, access and organize information and lately these kinds of technologies (for instance Google Earth and other similar projects) allow to use and represent also spatial information. This meets an increasing demand towards local search, or the search of facility objects that are close to you in real world. The latest developments, like Google Earth4 and Earth 3D2007, provide instruments which give the possibility to visualize buildings and surveys in 3D using realistic models. As an example, Google Earth’s potentials and the CityGML information model (http://www.citygml.org) have been used to create a 3D model of a small sample (about 10% of the whole area) of the city of Berlin (Kolbe, Gröger&Plümer, 2005).
Open and distributed GIS Web Services environments make it possible to acquire, process and analyse geographic information without needing to install proprietary GIS software and having GIS expert knowledge (Peng&Tsou, 2003). An important related question is: what/how much really needs to be visualized? How much detail is actually needed in the 3D visualization? In the present work we argue that interactively accessing and viewing information is very useful and therefore, in order to achieve interactivity, losing some detail is an acceptable trade-off. Moreover, an interactive platform could be exploited also for real-world applications, like the realization of a smart guide. A description of the first prototype of such a tool will be provided at the end of the paper.
Methodology
The Interactive 3D Interface
This research is focused on investigating a method to contextualize information to a specific ”zone” in a 3D environment. An important point in the development of this application is that it should work with commonly available hardware and possibly through Internet. In order to allow access to a wider audience, information should be accessible through an intuitive interface. For this reason we will use an interactive 3D model that reproduces the main features of the real environment, where the user can freely move in and find the sections he/she is interested in. We will present two case studies: Piazza Napoleone, a large square in Lucca (Italy) and the crypt of the Cathedral of St.Servatius in Quedlinburg (Sachsen-Anhalt, Germany). In particular, the second case study is related to a model which has a large amount of pre-existing geo-referenced information.
The Gaussian Information Zone
In the system we are proposing information is associated with regions of the 3D space, which we call Information Zones (IZ), and not just with single points like in many other existing systems. To represent IZs the simplest 3D volume is a sphere. A sphere defines a 3D zone in a very precise and sharp way, however it is just an approximation of the Information Zone we desire. A more convenient shape for our purposes should define a zone with a smooth boundary, therefore we decided to represent IZs using 3D Gaussians (Figure1) .
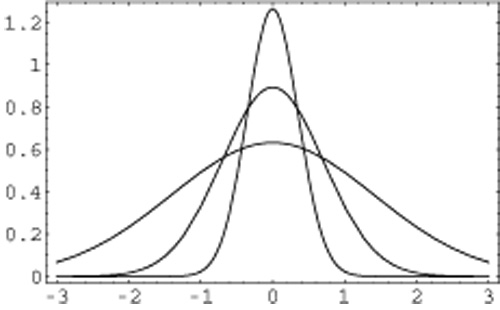
Figure 1: Plot of normalized Gaussians with width= 0.5,1.0,2.0 as function of the distance from the center.
There are several interesting advantages linked to this choice:
A 3D Gaussian is a function which assigns a value to each point of the space. There are no sharp boundaries, but rather a continuous distribution (like a charge distribution, or a fog) that is more concentrated at the center and decays with a given characteristic width going away from it. Figure 1 shows how the width controls how fast the Gaussian decays.
The IZ is realized associating information with a Gaussian centered on the object which we want to link the information to, and with a width comparable with its size. It is important to note that the Gaussian is not used to define the exact zone of the object of the information, but just an approximate zone used to search and retrieve the information.
In complex cases more that one Gaussian for information can be used.
The amount of information is not connected with the size of the Gaussian, which depends just on the size of the object of the information. A priori, all Gaussians should represent the same amount of information independently of their size. The use of a continuous distribution nicely solves this problem: Gaussians are normalized and, while a sharp Gaussian is smaller than a loose one, it also has a higher concentration so that the total amount of information is the same.
In the current stage of development a more precise definition of the zone can be stored in the information itself. In the future we might directly support more complex zones.

Figure 2: Contour plot of the overlap of two normalized
Gaussians with width “w1” and “w2” and a distance” r” between
the two centers.
It is important to note that Information Zones do not necessarily coincide with a 3D object represented in the model, they might be just a part of it or they might contain many objects at the same time. This kind of information association, in which it is not necessary to subdivide 3D model in logical sub-elements to attach information, represents a important advantage. For instance one can directly use meshes generated by 3D scanners without needing any particular post-processing in order to identify subportions of the models. On the other side, the indirect connection with 3D objects can also become a drawback, as it is not always easily possible to find exactly information related only to a given object.
The View Zone
The portion of the 3D model, which is being ”looked at” in the interactive 3D Viewer (View Zone - VZ ) is also approximated with a normalized 3D Gaussian. The center of the Gaussian is chosen on the point P, representing the first intersection between the 3D scene and a ray casted from the current point of view towards the center of the view plane, with a width proportional to the distance of the center P from the view point, so that it is similar to the size of the viewed area (Figure 3 - 4). This method has the advantage that View Zones and Information Zones are described similarly. This symmetric treatment of VZs and IZs let us use the interactive 3D viewer to visually insert the IZ of a piece of information, or to ”jump” immediately to the view related to some information.

Figure 3: Interactive 3D Viewer with the viewed area
VZ represented as green wire frame sphere.
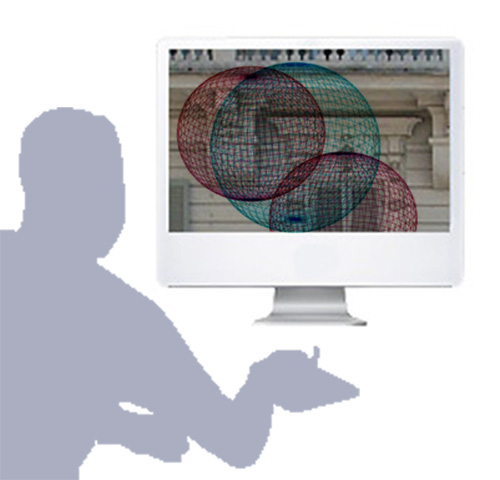
Figure 4: Interactive 3D Viewer with the viewing zone
VZ represented as a green sphere and two information zones IZ represented
as red spheres.
The Relevance Of Information
An innovative aspect of this approach is represented by the definition of “relevance of information”. Intuitively, the relevance of information should be maximal when its Information Zone (IZ) coincides with the Viewed Zone (VZ), decreasing when they are far apart. Moreover, as information is always associated with extended zones rather than with points, we can also use the size of a zone to decide if it is relevant. An IZ that has a size comparable to the current VZ is probably more interesting than an IZ that has a size (and thus a level of spatial detail) very different from the current VZ. Using the level of detail of the information is a big advantage with high densities of data. To implement this we need a precise definition of relevance. It turns out that given two normalized Gaussians:

the overlap SAB between them, defined as:
![]()
Has exactly the properties we want.
As it can be seen in Figure 4 the overlap SAB is
maximal when the two gaussians coincide (![]() and
and ![]()
![]() )
and gets smaller if the IZ is
far away or very differently sized.
)
and gets smaller if the IZ is
far away or very differently sized.
Thus we use the overlap between the Gaussians VZ and IZ as a measure of the relevance of the information connected to the actual view.
When browsing the data using this measure of relevance an ordered list of the most relevant information of the selected area (List Data) related to the VZ is built and visualized following the schema shown in Figure 5.

Figure 5: Interaction scheme of two use cases of ArchApp.
The Case Studies
Piazza Napoleone
Piazza Napoleone is a square ordered by Princess Elisa Baciocchi (with proclamation of the 1806 /1812) to the architect Giovanni Lazzaroni (1769/1834). In the project many important buildings were demolished in order to provide more space around the Ducal Palace, but this choice carries out the new overlooking sides of the square making it lose its original architectural and elegant beauty.
A geo-referenced 3D model has been created, using real information from topographical data. We used the ROMA40 datum with the Gauss Boaga coordinates projection system, because it is the geodetic reference system for the Italian cartography, and of the shapefiles that we had. In the system of reference Gauss-Boaga Italy is divided, from the meridian of Mountain Mario (Rome) , in two overlapping regions (East and West) of 6° of size. The two central meridians of these regions are the to 9° and 15° with respect to the meridian in Greenwich. In the 3D model we used a different false Northing and Easting than the ROMA40 Gauss-Boaga, so that the false origin would be in the Piazza Napoleone. This is necessary because some programs had problems with coordinates having “large” numbers: the accuracy of a single precision number corresponded to tens of centimetres and rounding errors where visible. After all these preparations a textured 3D model was created. The related information data is represented by architectural and historical information about the urban development of the square.
The Crypt Of The Cathedral Of St.Servatius
This beautiful place is inserted in the World Heritage List (UNESCO) and represents an exceptional example of a medieval European town. In particular the Collegiate Church of St. Servatius is one of the masterpieces of Romanesque architecture. The crypt is known not only for the tomb of the emperor Henry I, but also for a cycle of wall paintings of the 12th century. These paintings represent one of the largest painting cycles of that period in Germany, covering an area of more than 120 m².
The condition of the paintings when discovered was very inhomogeneous, largely reduced to the preparation layer, as they had been lime washed for around 350 years. After their uncovering they have been conserved in their reduced surface. Its conservation history is significant of the situation in the old Eastern Germany.
In the last seven years a relevant investigation and conservation program has been realized using extensionly GIS format as documentation tool. The base map consisted of high resulted rectified georeferenced fotographs. Additionally a 3D model creating a very detailed cloud of points of the crypt was elaborated by the use of a 3D scanner. The problem for this model has been to reduce the cloud points and to create by an appropriated interpolation and a complex fitting a good model to work on.
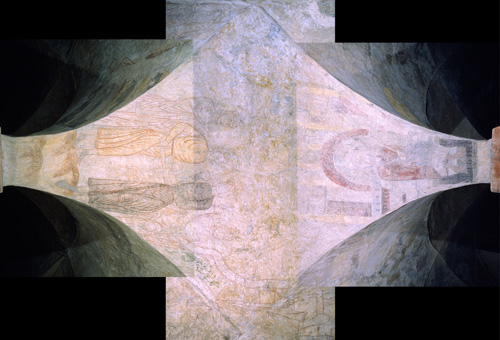
Figure 6: One orthophoto image of the crypt.
3D Visualization
When dealing with to the visualization of GIS data in a 3D environment, a technical difficulty is given from the absence of standard platform, therefore some “special” software is needed. Another problem is related to the interface to GIS software, which is often clumsy and complex for a first time user. Some more recent projects employ object-relational concepts to address the issues of integrated 3D geodata management within a 3D GIS framework.
To visualize and interactively navigate 3D models on the web, we used the XVR technology (Carrozzino, 2005), jointly developed by PERCRO Scuola Superiore Sant’Anna in Pisa (Italy) and VRMedia s.r.l. (http://www.vrmedia.it).
XVR is a fully integrated environment devoted to the development of Virtual Reality (VR) applications, based on a VR oriented scripting language specifically dedicated to 3D graphics, 3D sound and, in general, many other typical VR components. XVR is actually divided in two main modules: an ActiveX Control module, which hosts the interface to embed the 3D context inside web browsers, and the XVR Virtual Machine (VM) module, which contains the technology core, such as the 3D graphics, audio and physics engines, the multimedia engine and all the software modules managing the other built-in XVR features. It is also possible to load additional modules which offer advanced functionalities not directly available. The XVR scripting language allows the specification of the behaviour of the application, providing the basic language functionalities and the VR-related methods, available as functions or classes. The script is then compiled in a bytecode which is processed and executed by the XVR-VM. The integrated 3D engine, built on top of OpenGL, allows to manage the visual output not only on a standard graphical window (either Web or local hosted), but also on more advanced devices such as Stereo Projection Systems and Head Mounted Displays. The engine uses state of the art algorithms of culling, simplification, normal mapping and image caching to achieve good real-time performances even with high-complexity models. An exporter plug-in for the most known 3D modelling programs (such as 3D Studio Max, Maya and Blender) enables to import 3D models and associated textures into XVR. The interaction is then described by means of a Java-like scripting language.
As far as Web GIS are related, it must be noticed that traditional GIS systems have difficulty in delivering on line, distributed GIS Services and providing flexible, friendly GIS solutions for users (Peng&Tsou, 2003). Our Web GIS allows people around the world to access (and possibly modify) the data stored in and in perspective it could represent a solution to share spatial information in an easy way. The application focus on the visualization, sharing and handling of information in geographically small regions, coordinate transformations or the handling of projection must be performed externally.
Future Accessibility
The problem of the future accessibility is not the focus of this work, but we wish to make a couple of comments. Indeed, ensuring data access in the future is a difficult task that is often overlooked, but it is very important for an archive.
Open easy formats are the ones which have the highest probability of remain readable.
For text and images there are rather clear safe formats like as UTF-8 text, html, jpg, png,....whereas in 3D and GIS, where a loss of information when converting from one format to the other may happen the situation is less clear. For GIS data the Open Geospatial Consortium, OGC (http://www.opengeospatial.org/), is leading the development of standards for geospatial and location based services, and thanks to these efforts the situation might change. Still in this case proprietary formats might be more comfortable to handle at the moment.
File-system based storage has a higher probability of being readable in the future, without requiring any other program, and is easy to backup. On the other hand, in order to allow an effective access , database storage can be very useful to manage and query the information.
Our approach to these conflicting requirements has been to always have a file based directory structure that contains all the data. Each piece of data is stored in a directory that contains meta-information in html and xml format, along with data in different formats. With a script it is possible to load at once a directory tree of information in the database, making easy to backup and store this information. Having the possibility to store many different data formats for the same similar information increases the chances of being readable in the future and useful in the present.
The Prototypes
ArchApp
Our research focuses on establishing a method to connect information with an approximated zone in a 3D model, in order to find the information most closely related to the current view. ArchApp is a prototype being developed which explores some possible solutions. It is a Web GIS based on an application written with the Web framework Ruby on Rails (http://www.rubyonrails.org) which, using a database and a file based archive, lets the user insert, modify and browse the information using an XVR based 3D viewer (Figure 6).

Figure 7: The interface of ArchApp.
ISEE
For the case study of Piazza Napoleone we tested a real world application using a GPS Compass (Vector CSI Wireless) providing 2D heading and positioning data, connected to a laptop (Figure 7-8).

Figure 8: The Application ISEE
The goal was: “when you are moving in one context, you can access and see related information in real time”. The prototype allows one to move in the real environment and, on the basis of the data provided by the GPS, it provides automatically the information related to the portion of the real world is being looked at, e.g. the historic information of a facade of one building in front of us. This achieved by translating the GPS data in the reference system of our 3D model, so as to realize an exact overlap between the real square and the “virtual” one. In the first experiment we used a “cumbersome” prototype, making use of a notebook and of a large GPS device, but the target is to use portable devices, like a palm pc with GPS features provided with an electronic compass or with a gyroscope, in order to produce an interactive electronic smart guide.
Using a Vector GPS system connected to our laptop though the serial port we where able to orient the XVR 3D model so that its view coincides with what is looked at in the real world. To achieve this we wrote, starting from the pyGPS program, a python scripts that parses the nmea messages of the gps and makes the position and direction available on a local http server. The position is calculated transforming latitude and longitude to UTM Zone 32N, and then uses the seven parameters of the conformal Helmert transformation of the closest IGM point to Lucca to recover the coordinates of the 3D model.
The application was successfully implemented and we were able to retrieve information by just looking around. We also found some issues that will need to be addressed in the future.
- Smaller and more integrated instruments should be used.
- The program should be more robust towards periods of “bad signal” or “impossible” positions that will probably appear more frequently with smaller gps instruments.
- The method that we used to communicate the position of the gps to the Webpage in the actual prototype might not work using a remote Web server due to security restriction that javascripts may have in requesting data from a non-standard server/port combination and might have to be changed for future applications.

Figure 9: The images in the real time in the application
ISEE.
Conclusions
We have presented an intuitive and user-friendly interface to access, insert and modify the information in a 3D space. The association of the information with 3D zones (and not directly with the 3D model), allows an immediate use of 3D data coming from various sources (e.g. 3D scanners). The use of Gauss functions allows an efficient implementation of the relevant zones with a smooth distribution of information and of the ranking algorithm. Our proposed ranking method (using the overlap of gaussian functions) copes well with high densities of information and, together with the symmetric treatment of view and information zones, enables an intuitive interface. This method was successfully test in the ArchApp prototype application which has been used in two case-studies, allowing access to the data without having to install proprietary GIS software or having GIS expert knowledge. Finally, a first attempt of a prototype of an interactive smart guide based on our method was described.
References
Bowman, D:A:, Kruijff, E:, LaViola, J.J.Jr. & Poupyrev, I. (2004). 3D User Interfaces: theory and practice, Boston: Addison Wesley
Carrozzino, M., Tecchia, F., Bacinelli, S. & Bergamasco, M. (2005). Lowering the Development Time of Multimodal Interactive Application: The Real-life Experience of the XVR project. Proceedings of ACM SIGCHI International Conference ACE 2005.
Heinen, T., May, M. & Schmidt, B. (2005). 3D visualization in spatial data infrastructures. In Smart Graphics, Lecture Notes in Computer Science 3638, Springer, 222–229
Kolbe, T.H., Gröger, G. & Plümer, L. (2005). CityGML: Interoperable Access to 3D City Models. In P. van Oosterom, S. Zlatanova and E. M. Fendel (Ed.), Geo-information for Disaster Management, Berlin Heidelberg: Springer, 883-899.
Peng, Z.R. & Tsou, M.H. (2003). Internet GIS. New Jersey: Wiley.
Remondino, F. & El-Hakim, S. (2005). Critical overview of image-based 3d modelling. In E.Baltsavias, A.Gruen, L.Van Gool, M.Pateraki (Eds), Taylor & Francis / Balkema, 299-313
Ryan, N., Cinotti, T.S. & Raffa, G. (2005). Smart environments and their applications to cultural heritag. EPOCH Publication. Budapest, Hungary: Archaeolingua.
Schmidt, B. (2002). Verknüpfung der datenmodelle für gis und interaktive 3dvisualisierung. IfGIprints 1, Solingen, Germany: Verlag Natur & Wissenschaft
Zlatanova, S., Rahman, A.A. & Pilouk, M. (2002). Trends in 3d gis development. Journal of Geospatial Engineering 4(2), 71–80.
Cite as:
Pecchioli, L., et al., Accessing Information Through A 3D Interactive Environment , in International Cultural Heritage Informatics Meeting (ICHIM07): Proceedings, J. Trant and D. Bearman (eds). Toronto: Archives & Museum Informatics. 2007. Published October 24, 2007 at http://www.archimuse.com/ichim07/papers/pecchioli/pecchioli.html