
Introduction
Only a few days into a new decade, Google introduces the ‘Superphone’. Billed as the next wave in mobile technology, the Superphone joins the iPhone and smart phone in increasing the availability and ease with which consumers can download 3rd party content on the go – whatever, wherever, whenever (that is, as long as you are connected). The Superphone and other likely future technology advances will only increase consumer expectations of mobile technologies, and in doing so, provide a large receptive audience for cultural mobile content.
The pace of mobile technology evolution and the effect it is having on consumers are not surprising. Today, more than two-thirds of US consumers have broadband Internet, nearly half own an iPod or MP3 player, and ownership of smart phones is growing rapidly (Chart 1). With access comes usage and dependence: nearly all Internet users conducted an on-line search or found answers to specific questions in the past week, and young and old consumers value their Internet access just behind their car and a roof over their heads (Chart 2 and 3). However, with usage of digital platforms varying significantly between young and old, affecting consumer expectations of everyday tasks and special occasions, how will these digital content and mobile device usage trends affect visitor expectations of the museum experience, and how will museums and other cultural institutions meet the evolving needs and expectations of their audiences (Charts 4 and 5)?

Chart1: The Digital and Mobile Revolution…

Chart 2: The Top On-line Activities: Past Week
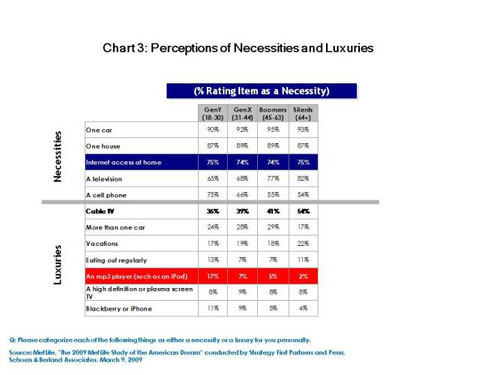
Chart 3: Perceptions of Necessities and Luxuries

Chart 4: Media Behaviors by Age

Chart 5: Usage of Community Sites Amongst Museum Audio Guide Visitors
1.0 Institutional Perspectives
How are cultural institutions adapting these mobile technologies and how do they see their audiences’ expectations changing? The huge variety of cultural institutions, geography and budgets makes it impossible to answer this question conclusively. However, surveying how institutions from around the global are developing and managing their mobile content provides insight into how institutions are responding to technology to enhance the visitor experience.
The institution research presented here is provided by the 2009 International Handheld Guide survey, a joint initiative between Learning Times and Loïc Tallon, which launched on-line in October 2009. The research objectives were to identify a) why institutions use handheld guides, and b) how institutions envision the future of mobile interpretations.
The survey sample covers a wide geography and type of cultural institutions offering a broad view of mobile guide practices across regions and type of institution (Chart 6 and 7). Among these organizations, more than half currently offer a mobile guide (Chart 8).

Chart 6: Institution Sample Country Distribution

Chart 7: Type of Institution

Chart 8: Does Your Institution Offer A Handheld Guide
Not all institutions offering a mobile guide are equal. Many are still learning how to develop and manage mobile guides, as nearly one-quarter of mobile guide institutions have offered a guide for less than one year, and half have had guides for less than 3 years (Chart 8). In terms of mobile guide format – not surprisingly, a majority offer a traditional audio guide format, with less than one-fifth offering a multimedia guide (Chart 9). In terms of applications of guides, most institutions use guides for both temporary exhibits and permanent displays, while a third provide guides for only permanent exhibits (Chart 10). Providing the visitors with access to guides is primarily done through visitor direct purchases or through bundling it with the general admission price. Slightly more than one-in-ten offer mobile content through visitors’ own personal devices, most often in the form of a mobile phone tour (Chart 11).

Chart 9: Type of Mobile Guide

Chart 10: Application of Mobile Guides to Collection and Exhibits

Chart 11: Mobile Guide Visitor Access
The primary objective of mobile guides is straightforward: to provide supplementary information. In this sense, the objectives of guides are to provide a very basic function. However, objectives important to the development of new guide formats, such as multimedia, are recognized by institutions; these include creating a more interactive experience, attracting new visitors, and keeping up with institutional peers and audience usage of new technology (Chart 12).

Chart 12: Mobile Guide Institution Objectives
Clearly, institutions are working both within and outside their organizations to develop and manage their guides (Chart 13). Key areas managed in-house include on-site management, design of guide experience, content production, and ongoing maintenance and production. A clear area where institutions seek outside help is for guide hardware and technical support. That said, confusion exists as to where institutions go for development or migration to new platforms.

Chart 13: Guide Development and Management
Key challenges facing institutions which manage mobile guides include updating content, cost of content creation, content production, and the cost of sustaining and maintaining the guide system (Chart 14). That said, few rate the purchase of the guide players, visitor provisioning and selection of the player as challenging, highlighting, to some extent, the low barrier to entry for mobile guides.

Chart 14: Challenges of Developing and Managing Mobile Guides
Institutions can clearly see how technology is pushing mobile guide evolution. In the next 5 years, the majority of institutions foresee an increase of downloads to visitors' own devices, an increase in use of in-house capabilities to develop content, and linking visitors' pre-, during-, and post-visit experience (Chart 15). Although rated lower, other important guide evolutions include the use of more powerful multimedia players, linking to community sites, the ability to upload content, and mobile content delivered via wi-fi. When these evolutions will take place is anyone’s guess; it will depend heavily on the size and commitment of institutions. But one thing is clear: few institutions foresee the end of their mobile guide programs.

Chart 15: Mobile Guide Evolution in the Next 5 Years
Keeping up with the pace of technology is never easy, but the majority of institutions make it a priority to keep up-to-date on the latest developments in mobile guides on either a regular or a project basis (Chart 16). Peer groups and custom visitor research rate the highest as important sources of information, followed by conferences and general Internet research (Chart 17).

Chart 16: Keeping Up-To-Date

Chart 17: Primary Sources of Information on Mobile Guides
2.0 Visitor’s Perspectives
Cultural institutions are rarely seen as a source or venue for advanced technology. Core to their mission is to preserve, interpret and provide access to cultural, artistic and historic collections. However, as audiences enter these institutions, they bring with them aspects of their daily lives that can influence the visiting experience. As highlighted in the introduction, consumers are heavily dependent on technology in their daily lives and as technology evolves, so do consumer behaviors and expectations. To assess how technology may be affecting the cultural arts experience, a series of institutional visitor research studies are reviewed. The research presented here is provided by leading museums in the US and Europe in partnership with Discovery Communications and Fusion Research + Analytics. A key theme through this breadth of research is an assessment of visitor expectations and behaviors and how demographics and/or the use of technology affect the visitor experience. The visitor research reviewed in this paper was undertaken at the following sites: Tate Britain, Tate Modern, National Gallery, English Heritage Down House, St Paul’s Cathedral, SFMoMA, and the Pergamon Museum.
It is important to first outline a demographic view of the museum visitor, and in particular identify visitors under the age of 35. These younger visitors have grown up using the Internet, digital media and mobile devices, and they accept and expect a level of integration of digital media into their museum experiences.
To assess how visitors’ expectations may vary by age, the first step is to identify how visitors plan their museum visit. At least two-thirds of visitors plan their visit prior to arriving at a museum or historic site; thus there is an opportunity for visitors to pre-engage with the institution and browse exhibits and establish expectations for what to see during a visit (Chart 18).
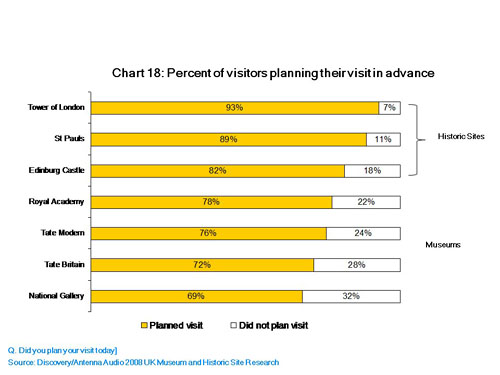
Chart 18: Percent of visitors planning their visit in advance
However, usage of museum/historic site Web sites varies significantly across venues – with museum sites being used the most and historic site Web sites the least (Chart 19). Consistently, museum visitors are more likely to access exhibit information while historic site visitors are more likely to consume general visitor and ticket information (Chart 20).

Chart 19: Usage of Museum/Historic Site Website
In general, younger visitors are less likely to access content on a museum Web site than older visitors – and in the case of the Pergamon Museum, older visitors are significantly more likely to access the museum Web site (Chart 20). Many visitors, especially younger visitors, are still likely to use traditional travel guides when planning their visit (Chart 21).

Chart 20: Sources Used to Plan Museum Visit

Chart 21: Usage of Museum Website by Age Group
The lower level of advance planning and museum Web site usage among younger visitors illustrates, in part, their reliance on mobile devices to access information from anywhere and likely a greater acceptance and expectation for interpretive mobile content.
The addressable market of mobile guide users is large (Chart 22). Across several museums, at least 4 out of 10 visitors say they use guides frequently or sometimes. Furthermore, contrary to industry myths, guide usage is not dependent on age – young visitors are just as likely as older visitors to use audio guides regularly (Chart 23). And the visitors’ motivation to use a mobile guide does not vary by age: across age groups, visitors are clearly motivated to use guides to learn or increase their level of entertainment or engagement in the museum experience (Chart 24). Where visitors do differ by age is in their expectation of the audio guide experience.

Chart 22: Market for mobile guides

Chart 23: Market for mobile guides by age group

Chart 24: Motive to Use Mobile Guides
Case studies
Two guide evaluation case studies illustrate key visitor guide expectations across age groups. The first case study was an evaluation of a recently launched multimedia guide at a historic site in Down House (Charles Darwin's house) outside of London. The multimedia guide was an integral and inclusive part of the visitor experience, and it covered both indoor and outdoor areas. A key objective of the multimedia guide was to provide an engaging experience for all visitors; however the site management harbored concerns that older visitors’ “lack of familiarity” with touch screen technology and multimedia format might hamper their experience.
Clearly, visitors varied in their assessment of guide attributes. Younger visitors were far more likely to characterize the guide experience as accessible, inspiring, and fun compared to older visitors (Chart 25). Furthermore, younger visitors rated the multimedia guide higher than other guides that they have used at other museums or historic sites (Chart 26). After using the multimedia guide, a large majority of visitors indicated a preference for a multimedia guide format – older visitors were only slightly less likely to prefer a multimedia format than younger visitors (Charts 27, 28). Young and old visitors expressed the opinion that the multimedia format allowed them to explore more of the site than they would have using a traditional audio tour and that the multimedia guide allowed them to learn more with less effort. Sample visitor feedback is listed below:
“Audio would have been enough, but I think the video adds something more” (age 45-54)
“Because it works better than just audio – you can see and hear and work less and learn more” (age 55-64)
“It helps keep the children interested and understanding what they are looking at. I also liked the map” (age 35-44)
“It’s perfect for complicated subject matter” (age 55-64)
“The video and audio is more interesting. And it’s easier to get something out of the experience” (age 25-34).
Overall, visitors across the age groups rated the guide highly – demonstrating that a multimedia guide can satisfy the demands of a younger audience but still meet the basic needs of an older audience (Chart 29).
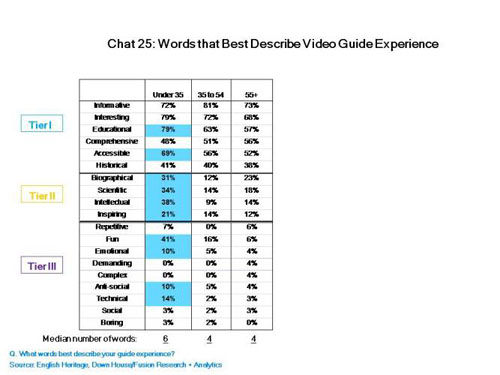
Chart 25: Words that Best Describe Multimedia Guide Experience

Chart 26: Multimedia Guide Experience Comparison

Chart 27: Mobile Guide Format Preference
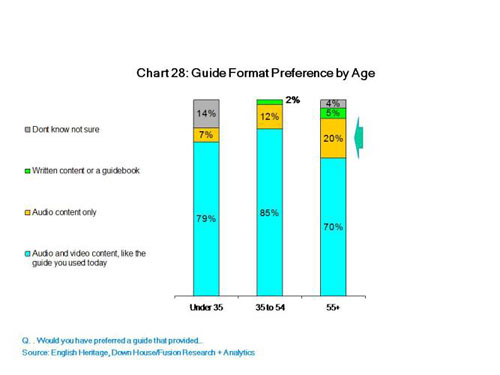
Chart 28: Mobile Guide Format Preference by Age

Chart 29: Likelihood to Recommend Multimedia Guide by Age
The second case study is in many ways opposite to the first. A historic site, with both indoor and outdoor areas, wanted to assess if a traditional audio guide was enough to meet the expectations of younger visitors. Aggregate evaluations of the traditional audio guide showed that visitors overall rated the guide relatively high (Chart 30) and it also compared well against peer institutions (Chart 31). However, a closer look revealed a significant difference in how younger and older visitors rated the guide and how the guide affected the overall experience (Chart 32). Focusing on visitors’ future guide feature preferences, it is clear that the traditional guide is not meeting younger visitors’ expectations - not based on perceived quality, but lack of media features they use in their daily lives (Chart 34).

Chart 30: Visitor Audio Guide Attributes Ratings

Chart 31: Likelihood to Recommend Guide Peer Comparison

Chart 32: Likelihood to Recommend Castle Guide by Age Group

Chart 33: Guide Effect on Visitor Experience by Age Group
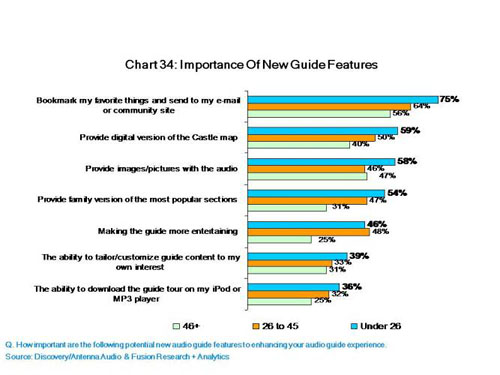
Chart 34: Importance of New Mobile Guide Features by Age Group
Devices preference and guide format are also critical questions in addressing how an evolving digital world is affecting visitor expectations. When asked whether they would prefer using their own device versus one provided by a museum or historic site, not surprisingly, older visitors are far more likely to prefer a museum-provided device than younger visitors (chart 35). Even among younger visitors, only a third would prefer using an iPod/MP3 player to access guide content. More indicative of visitor preference is guide format – clearly, younger visitors can see the benefits of a multimedia guide format, and a majority of younger visitors prefer a multimedia format to an audio-only format (Chart 36). In contrast, fewer older visitors intuitively see the benefits or need for a multimedia guide format.
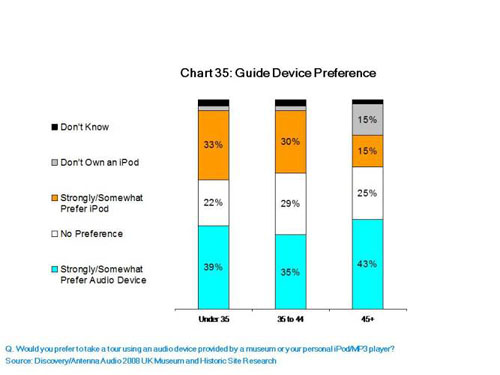
Chart 35: Mobile Guide Device Preference by Age Group
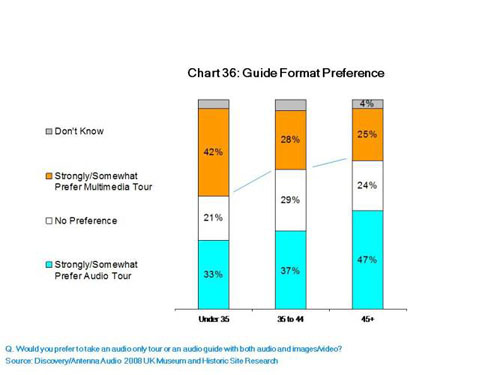
Chart 36: Mobile Guide Format Preference by Age Group
Conclusions and Implications
What does the future hold? How fast will visitor expectations change, and how will cultural institutions react to evolving visitor needs and the availability of digital technology? Leading cultural institutions are only now developing strategies in response to these questions. Focusing on the most advanced users of multimedia content (iPhone users) offers some insight into the growth of multimedia guides even in traditional museum settings.
Based on a recent survey conducted on the Berlin Museum Island, iPhone museum visitors are more likely to have used a museum multimedia guide format and are also most likely to prefer using their own personal device when accessing guide content (Charts 37 and 38). Finally, iPhone users are most confident about using their iPhone as the primary device to access guide content – above other devices such as black berries, iPods, and mobile phones (Chart 39). This trend in device preference will only increase as the segment of visitors owning Smartphones, iPhones, and Superphones grows.

Chart 37: Incidence of Past Mobile Multimedia Guide Use by Mobile Device Ownership

Chart 38: Guide Device Preference by Mobile Device

Chart 39: Personal Device Preference by Mobile Device
References
Discovery Communications/Antenna Audio (2008). UK Museum and Historic Site Research: Unpublished.
Discovery Communications/Antenna Audio/Fusion Research + Analytics (2009). Berlin Museum Island Research: Unpublished.
English Heritage Multimedia Evaluation (2009). Fusion Research + Analytics: Unpublished.
Forrester Research (2009). Technographics research report. (http://www.forrester.com/rb/research)
MetLife. "The 2009 MetLife Study of the American Dream" conducted by Strategy First Partners and Penn, Schoen & Berland Associates, March 9, 2009.
National Gallery Guide Evaluation (2009). Fusion Research + Analytics: Unpublished.
Nielsen Research (2008). Internet usage report. (http://en-us.nielsen.com/home)
Pew Research Center for the People and the Press (2008). iPhone Research. (http://pewresearch.org)
Tallon, Loïc. (2009). “The use, challenges & future of handheld guides in museums: An overview of the findings from the 2009 International Handheld Guide Survey”. LearningTimes & Pocket-Proof. (http://www.learningtimes.net/museumhandheldsurvey/)