Introduction
The project ‘The Digital-Signs in the Map of Mexico 1550’ is a project about open access, and has as the long-term purpose of supporting collaboration within Communities of Practice - COP (Wenger, 1998) and Communities of Interest - COI (Fischer, 2001) that are concerned with the dissemination and preservation of Mesoamerican cultural heritage. The first phase of this project also aims to become a wider collaborative research effort within the current social shift of the ‘culture of participation’ (Fischer, 2002). Since, the change towards a ‘culture of participation’ is driven not only by technological facts, but also by a combination of social interventions and practice-based innovation in the form of new content creation, this project seeks to study how these communities of researchers could adopt hypermedia systems to fulfill their own expression. These CoPs and CoIs include (but are not limited to) communities of cartographers, curators, epigraphers, students, and historians investigating Mesoamerican studies.
Since the spread of the hypertext model, there have been innumerable hypermedia-systems produced for different domain-oriented environments, some of which lately have been designed as open source and open content systems that have received broad social attention. But within the cultural heritage domain, there have not been many long-term studies designed to analyze the implications and actual research practice of communities and collaboration.
The project ‘The Digital-Signs in the Map of Mexico 1550’ intends to contribute to this social evolution from the cultural heritage academic work perspective. We do this by using digital instruments and media to bring together diverse forms of content in order to create a new ‘hypertext form’. Because we are aware of issues related to intellectual property rights, we report on the work done, in order to demonstrate possible new research practices and procedures with respect to creation and annotation of already existing content. At the same time, we are convinced that there would be countless benefits for the communities of scholars working with the Map if the works that have already been written about it were to be made available to the public through separate layers to the already existing Digital Facsimile.
The study is also part of a broader research interest in the creation of digital facsimiles within the ‘Systems of Representation Group’ of the Media Lab, School of Art and Design, of Aalto University, in Helsinki, Finland. See the project ‘Exploring Carta Marina’, a cultural heritage Forum built around Nordic cultural heritage and the narratives of the Carta Marina of 1539. (http://cipher.uiah.fi/index2.html?lang=en).
The Content and the Instruments
In 1997 the Media Lab of the University of Art and Design Helsinki, the Helsinki University of Technology, and the University of Uppsala´s Carolina Rediviva Library started a project to create a digital version of the ancient Map of Mexico also known as the Uppsala map and dated at 1550 (Díaz-Kommonen, 1998). The original artifact (that belongs to the Uppsala University Library, in Sweden) is a 114 cm x 78 cm painted parchment. The map depicts places and activities in what is known today as Mexico City around the year 1550, just decades after the ancient empire of the Aztecs and the city of Tenochtitlan had been conquered by the Spaniards in 1521:
The map is thought to be the work of the noted Spanish cosmographer Alonso de Santa Cruz and it is one of the only two known maps that give a fairly accurate picture of the city of Mexico and its surrounding regions on the mid 16th century. The map also gives information about the ethnography and the flora and fauna of the region (Diaz-Kommonen, under Background, 2007).
The noted Mesoamerican scholars Miguel León-Portilla and Carmen Aguilera are part of a group of scholars who have proposed that the artifact is an example of the conceptual forms of representation of two different cultures and that it was not created by Santa Cruz, but rather by members of the Aztec nobility working under the tutelage of Spanish monks in what became the first university in the Americas (Linne, 1947).
ImaNote (Image Map Annotation Notebook) is the latest and improved version of Display Map, a tool designed specially to exhibit the Digital Facsimile of the Map of Mexico 1550 on the Web. It was designed as a Web open source tool (Diaz & Parttanen, 2010). This means that the tool is freely accessible to be used, developed further and re-distributed by anyone through a GNU General Public License. The Image Map Annotation Notebook was developed by the ‘Systems of Representation’ research group in collaboration with the ‘Learning Environments’ group of Media Lab. The tool supports hypermedia annotation capabilities such as text, image, video, and tags over high-resolution images like maps. The interface also allows panning and zooming the high-definition image, and in addition allows sorting the annotations and supports RSS (Really Simple Syndication). RSS, developed by Netscape in 1999, is a syndication format that allows people to get content updates from their favorite Web sites within a single reader program (http://www.pcmag.com/encyclopedia/).
The design of the interface is based on a concept of layers of information that can be organized around a Group or theme, and annotations created and added to it. These annotations can be private or public. At present, there are two main groups created in the map: a Cultural_Heritage Sites group and a Signs group. The first displays annotations about Cultural Heritage places in Mexico City, and it is distinguished by a brown color. The second group that presents the Digital Signs is distinguished by a green color. As of this writing there are more than 173 digital annotations in the group that is related to the topic of this paper.
Building a Hypertextual Form Using Secondary Sources
The Signs of the Map
The original of the Map of Mexico 1550 depicts a large collection of signs or glyphs painted in the Mesoamerican writing way and have been described as Glifos Toponímicos by the Mexican anthropologists Miguel León-Portilla and Carmen Aguilera in their seminal book published in 1986, Mapa de México-Tenochtitlan y sus contornos hacia 1550. The Toponymic signs refer to the significance of the name of a place, and they also function as descriptors of settlements and geographical features. The context of the analysis of the signs that we present in this work includes: (1) name, (2) formal structures, (3) meaning as they have been elaborated by León-Portilla and Aguilera.
According to these scholars, educated ‘Indigenous artists-painters’, who were cognizant of both European writing and Nahua representation styles, painted the Map of Mexico 1550. The anthropologists believe that they were under the guidance of Spanish Monks, and that this might be the reason why some new and strange elements, animals, features and styles different from the Indigenous writing style were incorporated into the map. The researchers stated that there are almost 200 signs illustrating it, and that the signs are used following the Indigenous traditional way of signing settlements and geographical points.
The Signs: Four Groups
In the project we have followed the division analysis of the Toponymic signs set by the anthropologists in their study. This means that they have been divided into four large groups according to the characteristics and places they represent on the map. The groups are Mountains and Hills (Montes y Collados); Rivers and Tributaries (Ríos y Afluentes); Villages (Poblados); and Places (Parajes).
The first group ‘Mountains and Hills’ has 38 signs and encompasses the glyphs that have a ‘hill’ painted within its structure. The group ‘Rivers and Tributaries’ contains 41 signs. The third and the biggest is the group called ‘Villages’; the authors estimated that approximately 62 signs belong to this group, but we have only located 56 signs. The last group is denominated ‘Places’; it is the smallest one with only 38 signs. The anthropologists have reported that this group contains all the signs that have unclear associations to any village, mountains, or rivers. There is, however, the possibility that they give a name to a settlement, or to a geographical feature near to the place where they are located.
The Location of the Signs
León-Portilla and Aguilera’s publication has many illustrations and photographs of the original map. Though the photographic images are not of a high quality, the schematic representation in black and white drawings of the map provided in the publication is good. In this schematic drawing, or Diagrama del mapa de México-Tenochtitlan y sus contornos, the anthropologists divide the Map into eleven sections.
During the data-gathering phase in Helsinki, a similar schematic drawing in the form of a matrix was made in order to label and classify the multiple photographs - over 200 - used to create the Digital Facsimile. However, for the purpose of this study, we decided to use León-Portilla and Aguilera’s diagram and classification scheme of the elements in the Map. Note that similar schematic drawings of the map have been done earlier. A notable example is the work done with the map at the end of the 19th Century by the noted British artist/archaeologist Adela Breton. We believe that the conformation, standardization, or even inclusion of multiples of such representation and classification schemes can help to provide different perspectives to the data and will be a central issue in the future when editing the new classes of digital genres.
In the diagram by León-Portilla and Aguilera, each of the sections of the Map is given a number that it is used to identify the area in which a specific sign is located. The signs are also numbered, and their number is used as a reference within the text. For example, a sign in the text can be labeled: 7-31, which means that this specific sign is situated in section number seven of the map, and that the sign can be located in that section by finding the number thirty-one. In addition, next to the number thirty-one there is a small and simplified sketch (or icon) representing that sign; this icon makes easier and faster the identification of the sign in the map.
Form-giving in Digital Media
Since the first time that Theodor Nelson coined the term ‘hypertext’ as ‘[…] a body of written or pictorial material interconnected in such a complex way that it could not conveniently be presented or represented on paper […]’, in 1957; there have been several definitions of what hypertext, hypertext systems, and hypermedia are. A comprehensive analysis of what constitutes hypertext is beyond the scope of this paper. However, some of the basic characteristics shared are the possibility to access as well as link information and media in a non-sequential manner; a network of links to other nodes beyond itself; potential random access and multiple navigational paths; addition, annotation, and indexing of information.
One of our ultimate objectives is to investigate how to create digital networks of information and media, thus augmenting the possibility for scholars to work with cultural heritage artifacts. In this context, ‘The Digital-Signs in the Map of Mexico 1550’ is a project about the question of what ‘hypertextual form’ (Landow, 1997) is, how one is created using already existing scientific knowledge and a digital annotation tool, and what the problematics involved in the use of such tools and processes are. As more and more of these tools become available, there is a need to understand, in practice, what the limitations and the potential available through the use of such instruments are. This is why in this paper we have chosen to present the procedures involved as part of such work.
In terms of content, the aforementioned analysis made by the anthropologists in their book and the Digital Facsimile of the Map of Mexico created in Helsinki were the starting information points (or sources) for the ‘hypertextual form’ created within the Digital-Signs project. We were interested in learning about how the annotation process could work for the researcher, what sort of practices can be developed to organize the materials, as well as what details were involved in converting from a non-digital linear narrativeto a hypertext system. We were also interested in studying the narrative style and how it differs from one genre to another. In the case of León-Portilla and Aguilera’s book, the writing that is cited is very descriptive and full of composite information. Is it possible for a researcher to edit the writing while preserving the integrity of the original sources, and at the same time transfer the knowledge into a hypertext format?
The contents of the digital annotations that were used for this study are quoted from the general text of the book, as they are in the original Spanish. In some cases, however, we found that the in-depth analyses offered by León-Portilla and Aguilera was too long to fit into the annotation window so they were edited into shorter versions. In other cases they were edited in order to connect related information from other parts of the general text, but always preserving the quotation format and indicating the original source from which the text has been cited. Future interface developments for the ImaNote tool - or for similar annotation tools - will need to address these issues.
The ‘Tags’ (keywords) labeling the connection of the signs were created by the researchers in Helsinki in order to allow for searching through the sub categories produced by the new connections created. These keywords were selected by taking into consideration the attributes and significances of the signs, as described in the book by León-Portilla and Aguilera.
Cuetzpalan
En lo que toca a hidrónimos que incorporan glifos de animals […] la lagartija [puede representar] a un Cuetzpalan, “Lugar de lagartijas”.
El ícono pertenece al grupo ‘De ríos y sus afluentes (hidrónimos)’.
Tags: animal, Cuetzpalan, lagartija, río, río-y-afluentes.
Annotation for the sign ‘Cuetzpalan’ (small lizards’ place)
Building the Digital-Signs
The Annotation Process
In retrospect, we can report that the active process for the annotations took place in three phases: Phase 1, Preparing a Text from León-Portilla and Aguilera’s analysis; Phase 2, Preparing the Images; Phase 3, Creating the Annotations. After the first phase was completed, the second and the third phases were produced simultaneously. It was decided to proceed in this way because in order to prepare a .JPG image (second phase) and upload it (third phase), it was necessary to locate that image on the schematic diagram from the book. If the phases were done at the same time, the process would be simplified.
Phase 1: Preparing the Text.
The revision and editing of the information in Spanish used for the annotations of the Digital-Signs was a long and detailed process. A file documenting the summarized text was created using basic ‘TextEditor’ software. The nomenclature assigned by the authors of the book, the sign and its information were then included into each annotation. The information was written following the order in which the text would be displayed in the different fields options of the annotation tool: (1) ‘Title’ field, name of the sign; (2) ‘Annotation Text’ field, the edited text from the source; (3) ‘URL description’ field, name of the group which the signs belongs to; (4) ‘Tags’ field, the keywords connected to the sign.
The information of the 173 signs was prepared following the above description. After the textual information was ready, the second phase: Preparing the image files was organized. As already mentioned, the information used for creating the ‘hypertextual form’ comes from the research of one source. As an in-depth analysis, the writing style from this book is very descriptive, full of composite and valuable information. Note that although only one text was used for this study, nothing precludes the use of multiple sources in diverse genres. Further analysis of writing styles according to genre and how these affect the creation of form-giving in hypertext is an interesting path for future research.
Similar practices involving the marking and annotation of multiple sources are already available in commercial services such as the Questia on-line library. The difference between these services and what we envision through the use of a tool such as ImaNote is that with our software there would be a free exchange of information where members of CoPs and CoIs would retain full control of their Image notebooks.
Phase 2: Preparing the Images
The digital images of the signs–which will be called in this paper ‘Sign.jpg’– are close-ups from the painted signs in the original map. The Digital Facsimile high-resolution image of the map created in Helsinki was used as the source file for these close-ups. The digital images files were processed using an image-editing program, and they were saved as JPG files using as the name for the file their nomenclature; for instance, 7-31.jpg. To store the digital images of the signs, four separate folders were created (e.g. Rivers.jpg folder).
The task of creating the ‘Sign.jpg’ was a slow but not complicated process. First, the location of a sign was found by using the book’s schematic diagram provided (for example, 7-31.jpg); second, the Digital Facsimile high-resolution image of the map was opened in the image-editing program; third, the equivalent sign was located on the Digital Facsimile; fourth, the sign was cropped in the desired view; finally, it was saved as 7-31.jpg and was placed inside the corresponding folder (for instance, Rivers.jpg).
The ImaNote interface has an option called ‘Icon field’ which can be used to insert a miniature image related to the annotation. To manage the icons, the interface gives the following options: a check box ‘Visible for all’, to select the availability of the image; and a pull-down menu ‘Publish to group’, to select the group in which the annotation will be displayed on the interface. In the project ‘The Digital-Signs in the Map of Mexico 1550’, the ‘Icon field’ option was used to upload an image of the sign, it was set ‘Visible to all’, and it was published on the Signs group.
Phase 3: Creating the Annotations
In contrast to the text editing task and the creation of the ‘Sign.jpg’ file, the final step of making the annotations to create the ‘Digital-Sign’ with ImaNote interface was easier and faster.
Interpreting the Digital-Signs
Signs Layers
The interface concept of ImaNote opens up the possibilities of having several layers of information about the cultural digital object and also makes it feasible to approach several points of view over the same cultural digital object. We have referred to this as an ‘Open Interpretation’ approach (Díaz-Kommonen, Kaipainen, 2002). The interface can also be used as to display multiple visual layers of information.
The 173 digital annotations drawn from León-Portilla and Aguilera are the core of the present study of the Toponymic signs since they present explanations by these authors for the name’s meaning, and an analysis and a group to which the sign belongs. As a flexible hypertext form within the Digital Facsimile that allows for further compilation and comparison with other sources, the signs can now function like interpretation-devices for the identification of other graphic marks, and to augment and promote the study of the Toponymic signs.
Altogether, the project of the Digital-Signs could work as the first layer in a repository of information used to support researchers, archeologists, historians, and other members of CoPs and CoIs who might not be in the position of having access to the original artifact, or the secondary sources that have been created about it.
Since the visual representation of the Digital Facsimile is of such a high quality, the annotations of the Digital-Signs layer can also operate as a type of image-gallery for visualizing the formal characteristics of this kind of Indigenous writing, so that now they can be compared to other Toponymic signs existing on separate Mesoamerican maps, codices, stone monuments, and Colonial manuscripts. This comparative study could be done, for example by adding and annotating the signs on the same layer (or Group) of the ‘hypertextual form’, by linking to them any other hypermedia resource from the cyberspace, or by making a new layer (or Group).
The ‘Tags’ feature of the interface can help to make a more comprehensive analysis of the graphical characteristics existing on the Digital-Signs. This feature allows entering distinctive information and keywords related to each of the signs, and consequently deriving associations that might exist. For example, in the current work reported, the tags of the signs were decided according to their descriptive information, and also in relation to the group to which they belong. For example, the signs can be seen by groups (Places), or by things (Jade). If a researcher wants to see a connection of one sign to others, s/he can write down with ease a keyword in the ‘Search field’ and then press the ‘Search’ button; then, the tool will sort all the signs connected to that word. With this layer of visual information, any researcher will be able to see all the graphical similarities or differences of the connected signs.
The Connections
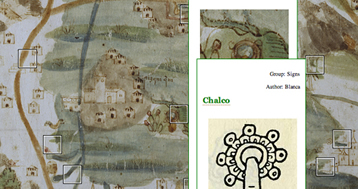
In a task search of the keyword ríos (rivers in English), the tool displays the result of 45 signs related to the topic; 44 signs from the ‘Rivers and Tributaries’ group, plus one more from other annotations previously done in the group ‘Cultural Heritage Sites’. This latter group has annotations about historical places that can be found on the map; some of them were built in Mexico City many centuries after the Map of Mexico 1550 was painted. The 45 results of this search task are displayed in the form of a visual list showing the name of the sign, a good quality image of the sign, all the text of the annotation, last date and time of the editing, the author, as well as the group to which this sign belongs (see Fig.1). Such a list can help users to compare and notice the similarities or differences between the signs, and it also allows them to see in close detail the painted signs and their formal characteristics.
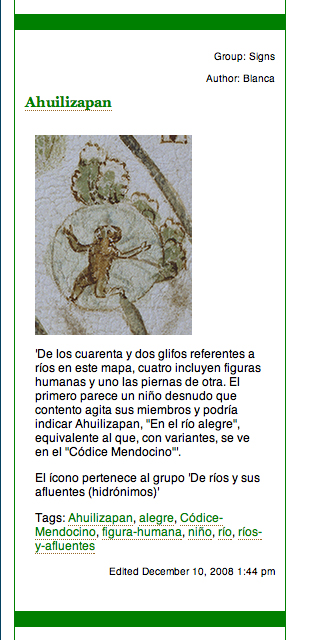
Fig 1: The sorting result of ríos. Detail
Since the ImaNote tool also gives the possibility of making several annotations in relation to a sign, or in connection to it, a second task was performed to illustrate the case of connecting a sign with other glyphs depicted in a different source. For instance, in the Map of Mexico 1550, there is a sign that belongs to the ‘Villages’ group, and it is called Xihco (Nahuatl language), En el lugar del ombligo (Spanish): ‘At the bellybutton place’ (see Fig.2).
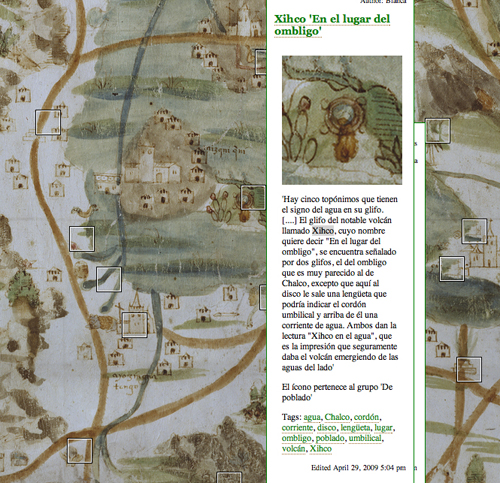
Fig 2: The annotation of Xihco Sign of the Map of Mexico 1550. Detail
This sign has a painted graphical structure (icon) which is quite similar to the one that belongs to a place called Chalco, ‘bellybutton’ (León Portilla & Aguilera 1986). The icon of Chalco is also found on the stone monument called Piedra de Tízoc (Tízoc Stone), which is a Pre-Hispanic monument holding engraved names of the places that Tízoc, a Mexican king, conquered (León-Portilla 1992). (See Fig.3).
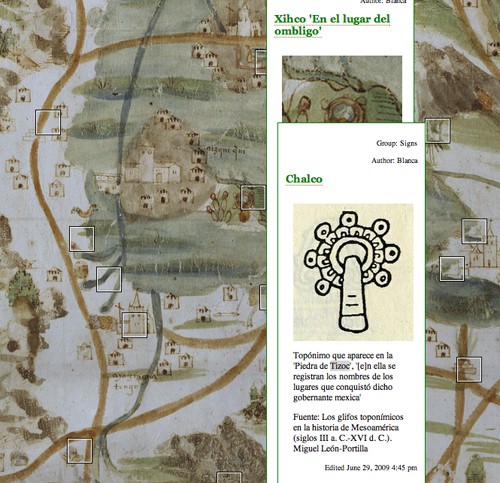
Fig 3: The annotation of Chalco Sign from Tízoc Stone. Behind it, it can be seen Xihco Sign of the Map of Mexico 1550. Detail
Comparing the two annotations (1) the Map of Mexico 1550 sign and (2) the Piedra de Tízoc sign not only gives the possibility to analyze the similarities of the icons, but also delivers the connections of the signs, because the annotations work as Interpretation-devices. The former examples illustrate the capabilities that this hypermedia annotation system has in respect to the documentation and scholarship of Mesoamerican studies. Further projects within Communities of Interest and Communities of Practice can be developed to increment the annotations and connections of these cultural assets; the social features implicit in the design of ImaNote as an open tool open up these possibilities.
Conclusion
One of the main purposes of this project is to research the design and building of networks of information and digital media through the use of digital tools such as ‘ImaNote’ for ‘Communities of Practice’ and ‘Communities of Interest’ within the cultural digital heritage domain. We are also interested in acquiring information of how digital annotation tools support the practice of research and documentation for specialists investigating Mesoamerican studies, and how non-linear research sources can be transformed into a hypertext system.The first phase of this project sets a foundation by demonstrating how to create one perspective ‘hypertextual form’ on the subject of the graphic marks and Toponymic signs of the Map of Mexico 1550 as researched, analyzed and published by two experts in Mesoamerican studies. This ‘hypertextual-form’ created is one of the several possible layers of information of existing sources about the map that can be build around it, using the Image Map Annotation Notebook presented in this project. Continuing the development of further layers of content creation from other sources can also bring lots of assets for researchers and scholars interested in the original Map.
Finally, this project also reports on the functionality of the open annotation tool used for the creation of the 173 digital annotations as well as commenting on how the ‘hypertextual form’ can be used for connecting separate kinds of digital information such as Codices, stone monuments, and Colonial manuscripts.
Taking advantage of the networking possibilities that hypermedia systems allow and following with the ‘culture of participation’ shift, the project ‘The Digital-Signs in the Map of Mexico 1550’ will focus future efforts on the development of widespread collaborative research on digital heritage. The second phase of the project will include the planning and implementation of strategies to integrate CoPs and CoIs into the project, and the design of scenarios for social interventions and content creation by the members of those communities. The outcome of this on-going process project will be the analysis of research activities intertwined with communities and collaboration.
Acknowledgments
The authors would like to thank the anthropologists Miguel León-Portilla and Carmen Aguilera for their research about the interpretation of the signs in the original Map of Mexico 1550 which has widely contributed to the scholarship of Mesoamerican studies. In the same manner, the authors would like to acknowledge that their work was an important information resource for the ‘hypertextual-form’ created in the project ‘The Digital-Signs in the Map of Mexico 1550’.
References
Diaz-Kommonen, L. (1998). Digital Archaeology: Connecting Historical Narratives and Digital Environments. Leonardo, Journal of the International Society for the Arts, Science and Technology, 31(4), 283-287.
Diaz-Kommonen, L. (2007). “Designing and Producing Digital Cultural Heritage: The Map of Mexico 1550”. In A. Sbrilli (Ed.) Engramma, la tradizione classica nella memoria occidentale, Vol. 54 (gennaio-febbraio 2007), University of Venice, Italy. Available at Virtual Cartography: Map of Mexico 1550 ‹http://cipher.uiah.fi/mexico_new/publications.html› (Accessed Nov 28, 2009).
Diaz-Kommonen, L. & M. Kaipainen (2002). “Designing Vector-Based Ontologies: Can Technology Empower Open Interpretation of Cultural Heritage Objects?” Proceedings of DEXA 2002, Thirteenth International Workshop on Database and Expert Systems Applications, IEEE Computer Society, Los Alamitos, CA, 521-525.
Díaz, L, & L. Parttanen (2010). “Digital Cultural Heritage to Support Novel Activities in the Classroom of the Future”. In K. Mäkitalo-Siegl, F. Kaplan, J. Zottmann, & F. Fischer (Eds.) The Classroom of the Future, Orchestrating Collaborative Spaces. Sense Publishers, The Netherlands, 181-198.
Fischer, G. (2001). “Communities of Interest: Learning Through the Interaction of Multiple Knowledge Systems”. In S. Bjornestad, R. Morch, A. Opdahl (Eds.) Proceedings of the 24th IRIS Conference. Ulvik, Bergen, Norway: Department of Information Science. 11-14. Available at ‹http://l3d.cs.colorado.edu/~gerhard/papers/iris24.pdf› (Accessed November 30, 2009).
Landow, G.P. (1997). Hypertext 2.0. Hypertext: The Converge of Contemporary Critical Theory and Technology. London: The John Hopkins University Press.
León-Portilla, M. (1992). Los glifos toponímicos en la historia de Mesoamérica (siglos III a. C.-XVI d. C.). Instituto Nacional de Antropología e Historia. Zapopan, Jalisco: El Colegio de Jalisco.
León-Portilla, M. & C. Aguilera (1986). Mapa de México-Tenochtitlan y sus contornos hacia 1550. Mexico DF: Celanese Mexicana.
Linne, S. (1947). El Valle y la Ciudad de México en 1550, Relación histórica fundada sobre un mapa geográfico que se conserva en la biblioteca de la Universidad de Uppsala, Suecia. The Ethnographical Museum of Sweden, New Series Publication, No.9, Stockholm, Sweden.
Nelson, Theodor (1965). “A File Structure for the Complex, the Changing, and the Indeterminate”. In L. Winner (Ed) Association for Computing Machinery: Proceedings of the 20th National Conference, 84-100.
Wenger, E. (1998). Communities of Practice: Learning, Meaning, and Identity. Cambridge: The University Press.